简体中文
繁體中文
English
Pусский
日本語
ภาษาไทย
Tiếng Việt
Bahasa Indonesia
Español
हिन्दी
Filippiiniläinen
Français
Deutsch
Português
Türkçe
한국어
العربية


Australian Dollar Outlook: AUD/USD & AUD/JPY Eye RBA Meeting
الملخص:The September RBA meeting is now 1-week away which sets AUDUSD and AUDJPY back in the spotlight. Where might the Australian Dollar head next?
AUSTRALIAN DOLLAR PRICE SET TO SWING AHEAD OF SEPTEMBER RBA MEETING
AUDUSD and AUDJPY remain bogged down by broad-based risk aversion in light of lingering trade war uncertainty and elevated recession fears
The Australian Dollar will likely gyrate within its August trading range as forex traders await the September RBA meeting a week away
Sharpen your skills as a forex trader with this free educational guide on Building Confidence in Trading
RESERVE BANK OF AUSTRALIA INTEREST RATE CUT PROBABILITY (SEPTEMBER 2019)
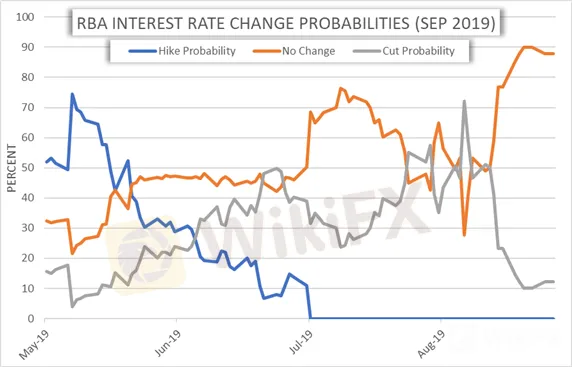
That said, overnight swaps are currently pricing an 87.8% probability that the RBA leaves rates unchanged at the central banks next interest rate decision but placing the odds of another RBA rate cut by year-end at 88.0%. A surprise RBA interest rate cut stands to send the Australian Dollar plunging, but this scenario is not likely considering recent commentary from RBA Governor Lowe who hinted at the limitations of monetary policy at the Jackson Hole Economic Symposium last weekend.
AUSTRALIAN DOLLAR 25D RISK REVERSALS (1-WEEK)

Nevertheless, the currency markets bias remains tilted to the downside judging by the 1-week risk reversal metrics for AUDUSD and AUDJPY. Yet, the recent influx of market risk appetite following the supposed trade war de-escalation could be contributing to the marginal bump in Australian Dollar risk reversals measures.
AUDUSD PRICE CHART: DAILY TIME FRAME (APRIL 01, 2019 TO AUGUST 27, 2019)

Spot AUDUSD is expected to trade between 0.6691-0.6815 with a 68% statistical probability as calculated using the currency pair‘s 1-week implied volatility reading of 7.82%. The 1-standard deviation option implied trading range just so happens to measure up closely with spot AUDUSD’s year-to-date low and 23.6% Fibonacci retracement of its April swing high, which reiterates the major confluence levels as technical support and resistance. We have previously highlighted resistance posed by the 0.6800 handle in our most recent AUDUSD price outlook where we stated that the Australian Dollar could be primed for a breakdown – a view we still hold which may materialize on dovish commentary revealed during the September RBA meeting.
AUDJPY PRICE CHART: DAILY TIME FRAME (APRIL 01, 2019 TO AUGUST 27, 2019)

Judging by AUDJPYs 1-week implied volatility reading of 12.56%, the currency pair is estimated to trade between 70.343-72.443 with a 68% statistical probability. The technical backdrop of AUDJPY is quite similar to that of AUDUSD. Spot AUDJPY has also struggled due to major technical resistance around the 72.000 handle which has served as a major headwind for Australian Dollar bulls.
عدم اعطاء رأي:
الآراء الواردة في هذه المقالة تمثل فقط الآراء الشخصية للمؤلف ولا تشكل نصيحة استثمارية لهذه المنصة. لا تضمن هذه المنصة دقة معلومات المقالة واكتمالها وتوقيتها ، كما أنها ليست مسؤولة عن أي خسارة ناتجة عن استخدام معلومات المقالة أو الاعتماد عليها.
وسيط WikiFX
أحدث الأخبار
شركة XS.com المراجعة الكاملة 2025 : موثوقة أم احتيال ؟
 WikiFX
الاستفادة من تحليل البيانات الضخمة في تداول الفوركس
WikiFXشركة INFINQX المراجعة الكاملة 2025 : موثوقة أم احتيال ؟
WikiFXمنصة أوربكس ORBEX | المراجعة الكاملة 2025: موثوقة أم احتيال؟
WikiFXغارق في دوامة التداول | كيف يدمّرك فرط المعلومات في التداول الرقمي؟
WikiFXكيفية تجنب مخاطر الوسطاء الاحتياليين في الفوركس | WikiFX يساعدك عبر التراخيص التنظيمية
WikiFXحساب النسبة

