简体中文
繁體中文
English
Pусский
日本語
ภาษาไทย
Tiếng Việt
Bahasa Indonesia
Español
हिन्दी
Filippiiniläinen
Français
Deutsch
Português
Türkçe
한국어
العربية
FPG AUS200 Market Report December 19, 2024
Sommario:AUS200 on the weekly time frame remains in a dominant bullish trend despite recent price volatility. The index successfully rebounded after experiencing bearish movement over the past two weeks, using
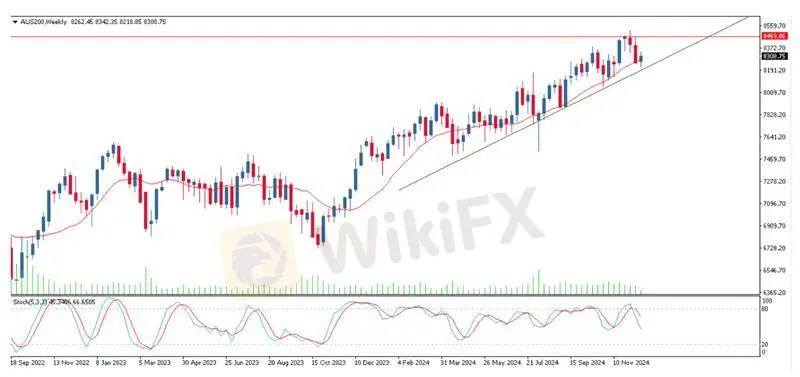
AUS200 on the weekly time frame remains in a dominant bullish trend despite recent price volatility. The index successfully rebounded after experiencing bearish movement over the past two weeks, using the ascending trend line as strong support. Currently, AUS200 is traded around 8308.75, showing signs of a potential continuation of the bullish momentum.
On the weekly chart, AUS200 maintains its bullish structure while respecting the ascending trend line support. Price has rebounded after a minor correction, signaling strength in buyer momentum. If the index successfully breaks above the critical resistance at 8459.86, this could confirm a continuation of the uptrend, pushing AUS200 into a new bullish phase.
However, failure to hold the trend line support could shift the outlook toward a bearish reversal, signaling a deeper correction. The stochastic indicator, currently at 66, shows a slight downturn, indicating that traders should remain cautious of short-term exhaustion in the current rally.

Market Observation & Strategy Advice:
1. Support Trendline: The trendline support has been retested, and a rebound indicates ongoing bullish strength.
2. Resistance Zone: Monitor the 8459.86 resistance; a breakout could lead to a strong bullish continuation.
3. Bearish Risk: If AUS200 breaks below the ascending trendline, a prolonged bearish reversal may occur.
4. Stochastic Momentum: The stochastic indicator signals possible exhaustion, so traders should be prepared for short-term pullbacks.
Market Indices Performance:
Index Last % Change
AUS200 8,185.54 −1.94%
US30 42,399.00 +0.25%
UK100 8,112.29 −1.02%
Today's Key Economic Calendar:
AU: Unemployment Rate (Monthly)
US: Initial Jobless Claims, Philadelphia Fed Manufacturing Index
UK: Retail Sales (MoM)
EU: Consumer Confidence Index
JP: Monetary Policy Statement
Risk Disclaimer This report is for informational purposes only and does not constitute financial advice. Investments involve risks, and past performance does not guarantee future results. Consult your financial advisor for personalized investment strategies.
Disclaimer:
Le opinioni di questo articolo rappresentano solo le opinioni personali dell’autore e non costituiscono consulenza in materia di investimenti per questa piattaforma. La piattaforma non garantisce l’accuratezza, la completezza e la tempestività delle informazioni relative all’articolo, né è responsabile delle perdite causate dall’uso o dall’affidamento delle informazioni relative all’articolo.
WikiFX Trader
Doo Prime
XM
FBS
FOREX.com
AvaTrade
TMGM
Doo Prime
XM
FBS
FOREX.com
AvaTrade
TMGM
WikiFX Trader
Doo Prime
XM
FBS
FOREX.com
AvaTrade
TMGM
Doo Prime
XM
FBS
FOREX.com
AvaTrade
TMGM
Rate Calc


