简体中文
繁體中文
English
Pусский
日本語
ภาษาไทย
Tiếng Việt
Bahasa Indonesia
Español
हिन्दी
Filippiiniläinen
Français
Deutsch
Português
Türkçe
한국어
العربية


US Household Net Worth Collapses by Nearly $4 Trillion
Lời nói đầu:US Household Net Worth falls by most since the financial crisis to $104.3 Trillion at the end of 2018.
4Q 2018 US HOUSEHOLD NET WORTH – TALKING POINT
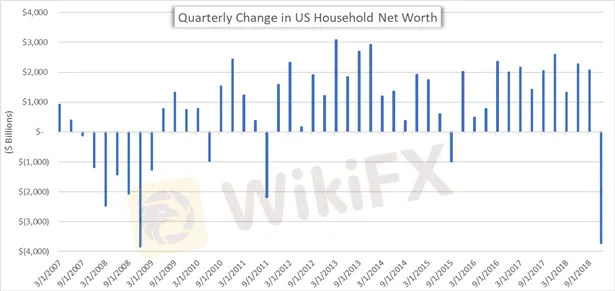
Household Net Worth in the US for 4Q fell to $104 Trillion from $108 Trillion in the period prior
A widespread selloff in risk assets at the end of 2018 sent stock prices tumbling lower and labeled as the primary contributor to the 3.5 percent decline in US household wealth
Check out the free DailyFX Building Confidence in Trading Guide for tips on how to sharpen your trading skills!
Household wealth in the United States dipped by 3.5 percent, a decline of $3.7 Trillion, over 4Q 2018 driven primarily by a cratering stock market. US Household Net Worth of $104.3 Trillion at the end of year compares to third quarters reading of $108 Trillion.The report for the current period showed the largest drop in household wealth since the Great Financial Crisis.
US HOUSEHOLD NET WORTH PRICE CHART: QUARTERLY TIME FRAME (JANUARY 2007 TO DECEMBER 2018)
Immediately following the report, the US Dollar was little changed but upward momentum looks to fade following solid gains made earlier in todays session.
DXY US DOLLAR INDEX CURRENCY PRICE CHART: 1-MINUTE TIME FRAME (MARCH 07, 2019 INTRADAY)

Unsure about the USD‘s next direction? Download the free USD Forecast for comprehensive insight from DailyFX’s analyst on the currencys outlook!
The $3.9 Trillion decline in financial assets over the months of October through December was widely attributable to the near 20 percent slide in US equity prices. Although, the decline was partially offset by a modest $300 Billion rise in the value of real estate.
DOW JONES INDUSTRIAL AVERAGE INDEX PRICE CHART: DAILY TIME FRAME (OCTOBER 01, 2018 TO DECEMBER 31, 2018)

The report also showed that domestic nonfinancial debt grew at a 2.7 percent seasonally adjusted annual rate which is lower than the 4.5 percent rate reported in 3Q 2018. However, household debt still climbed $241 Billion over the final quarter of the year. Also noteworthy from the release was the slide in the personal savings rate from 3.53 percent to 3.07 percent.
Miễn trừ trách nhiệm:
Các ý kiến trong bài viết này chỉ thể hiện quan điểm cá nhân của tác giả và không phải lời khuyên đầu tư. Thông tin trong bài viết mang tính tham khảo và không đảm bảo tính chính xác tuyệt đối. Nền tảng không chịu trách nhiệm cho bất kỳ quyết định đầu tư nào được đưa ra dựa trên nội dung này.
Sàn môi giới
STARTRADER
GO MARKETS
Vantage
XM
FBS
IC Markets Global
STARTRADER
GO MARKETS
Vantage
XM
FBS
IC Markets Global
Sàn môi giới
STARTRADER
GO MARKETS
Vantage
XM
FBS
IC Markets Global
STARTRADER
GO MARKETS
Vantage
XM
FBS
IC Markets Global
Tin HOT
Tin tức Forex 17/03: Sàn XM tung cơ chế mới hỗ trợ đối tác
 WikiFX
Thấy gì từ sự kiện Pi Network thu hồi hàng loạt đồng Pi khiến cộng đồng tẩy chay?
WikiFXWikiFX Review sàn Forex Vantage 2025: Hành trình chinh phục trader Việt?
WikiFXPi Network và tin đồn cơ chế neo giá: Những điều bạn cần biết
WikiFXLàm sao để tránh bẫy sàn lừa đảo khi đầu tư Forex? Đây là Tips từ WikiFX
WikiFXBí quyết giao dịch Forex giúp bạn thắng lớn mà không cần margin cao
WikiFXCơn sốt đầu tư Pi Network: Bao nhiêu người Việt Nam đang tham gia?
WikiFXPi Network hôm nay: Ai cứu 'Pi thủ' đây?
WikiFXPi Network hôm nay: Giá Pi sắp phục hồi vì một tín hiệu tích cực mới?
WikiFXPi Network hôm nay: Chuyên gia dự báo giá Pi sắp tới sẽ đạt con số kỷ lục!
WikiFXTính tỷ giá hối đoái

