简体中文
繁體中文
English
Pусский
日本語
ภาษาไทย
Tiếng Việt
Bahasa Indonesia
Español
हिन्दी
Filippiiniläinen
Français
Deutsch
Português
Türkçe
한국어
العربية


XAUUSD: Spot Gold Price Chart Suggests Further Pullback Risk
Lời nói đầu:Spot gold is down roughly 4 percent since its recent peak in February, but the precious metal could see further downside.
SPOT GOLD PRICE – TALKING POINTS
Gold prices now rest below support at the $1,300 level after sustained downward pressure since topping out mid-February at the $1,345 area, which puts XAUUSD at risk for additional downside
Markets may continue to overlook gold in the short-term as risk-on sentiment gains momentum on the back of rebounding yields, improving economic data
New to trading or simply looking to sharpen your strategy? Read up on How to Trade Gold or learn about Trading the Gold to Silver Ratio
Gold appears to have lost some of its luster over the last month and a half with XAUUSD selling off nearly 4 percent since spot prices peaked mid-February. Now, gold sits below technical support at the $1,300 price level which could put the precious metal at risk for further short-term downside.
SPOT GOLD PRICE CHART: DAILY TIME FRAME (AUGUST 15, 2018 TO APRIL 1, 2019)
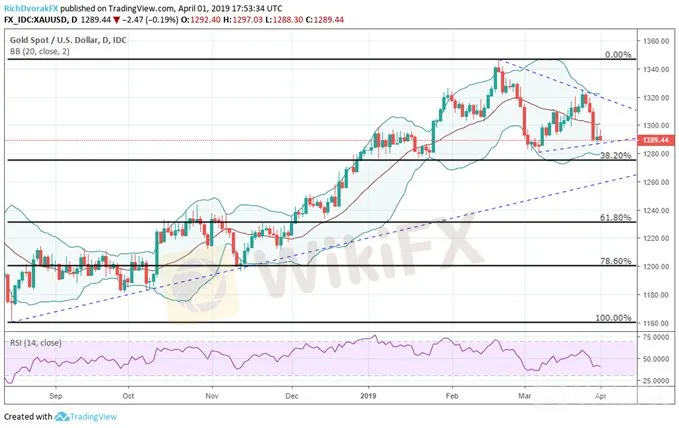
With spot gold‘s latest plunge, prices could extend even lower towards the 38.2 percent Fibonacci retracement line to find support around $1,280. Aside from the bearish technical picture, rebounding yields could further exacerbate gold’s recent weakness.
Gold failed to mirror the anti-risk rally in Treasuries over the second half of March which was largely triggered by the Federal Reserve announcing its latest dovish position and downward revisions to economic growth forecasts. The decline in the US 10-Year Treasury yield from 2.76 percent at the beginning of last month down to 2.36 percent on March 27 – its lowest level since December 18, 2017 – has since rebounded sharply back to 2.49 percent.
Take a look at this free educational guide on Building Confidence in Trading
Recent manufacturing data out of China and the US could be sparking the latest risk-on rally after both countries showed improvement. Consequently, the latest economic readings may suggest that fears of slowing global growth are overdone which in turn could push yields higher and gold prices lower considering their inverse relationship. That being said, the short-term uptrend line formed by the lows in spot gold on March 7 and March 29 could provide technical support.
SPOT GOLD TRADER CLIENT SENTIMENT
Check out IGs Client Sentiment here for more detail on the bullish and bearish biases of EURUSD, GBPUSD, USDJPY, Gold, Bitcoin and S&P500.
According to spot gold client positioning data from IG, 76.9 percent of traders are net long resulting in a ratio of traders long to short of 3.32 to 1. Despite the dip in XAUUSD from the $1,320 price level, spot gold traders have increased their bullish bias with the number of traders net-long rising 7.5 percent relative to last week.
Miễn trừ trách nhiệm:
Các ý kiến trong bài viết này chỉ thể hiện quan điểm cá nhân của tác giả và không phải lời khuyên đầu tư. Thông tin trong bài viết mang tính tham khảo và không đảm bảo tính chính xác tuyệt đối. Nền tảng không chịu trách nhiệm cho bất kỳ quyết định đầu tư nào được đưa ra dựa trên nội dung này.
Sàn môi giới
Exness
FP Markets
IC Markets Global
IB
TMGM
STARTRADER
Exness
FP Markets
IC Markets Global
IB
TMGM
STARTRADER
Sàn môi giới
Exness
FP Markets
IC Markets Global
IB
TMGM
STARTRADER
Exness
FP Markets
IC Markets Global
IB
TMGM
STARTRADER
Tin HOT
Tin tức Forex 17/03: Sàn XM tung cơ chế mới hỗ trợ đối tác
 WikiFX
Thấy gì từ sự kiện Pi Network thu hồi hàng loạt đồng Pi khiến cộng đồng tẩy chay?
WikiFXPi Network hôm nay: Giá Pi sắp phục hồi vì một tín hiệu tích cực mới?
WikiFXTính tỷ giá hối đoái

