简体中文
繁體中文
English
Pусский
日本語
ภาษาไทย
Tiếng Việt
Bahasa Indonesia
Español
हिन्दी
Filippiiniläinen
Français
Deutsch
Português
Türkçe
한국어
العربية


Gold Price Weekly Outlook: Gold Rips to 5-Year Highs- Buyers Beware
Lời nói đầu:Gold prices are poised to post the largest weekly advance in three years with price probing key resistance. These are the levels that matter on the XAU/USD weekly chart.
Gold price rally testing resistance at 2014 highs- trade remains constructive above 1327
2014年高位的黄金价格反弹测试阻力仍高于1327
Gold prices are up more than 4.1% this week and for a fifth consecutive weekly advance in XAU/USD. The rally marks the largest single-week advance since April of 2016 with price now probing a key resistance zone at fresh five-year highs. These are the updated targets and invalidation levels that matter on the XAU/USD weekly price chart. Review my latestWeekly Strategy Webinar for an in-depth breakdown of this setup and more.
本周黄金价格上涨超过4.1%,连续第五个月上涨每周XAU / USD的预付款。此反弹是自2016年4月以来单周最大涨幅,价格正在探讨新的五年高点的关键阻力区。这些是XAU / USD每周价格图表中重要的更新目标和失效水平。查看我的最新周刊策略网络研讨会,深入了解此设置及其他内容。
Gold Price Chart - XAU/USD Weekly
黄金价格走势图 - XAU / USD每周
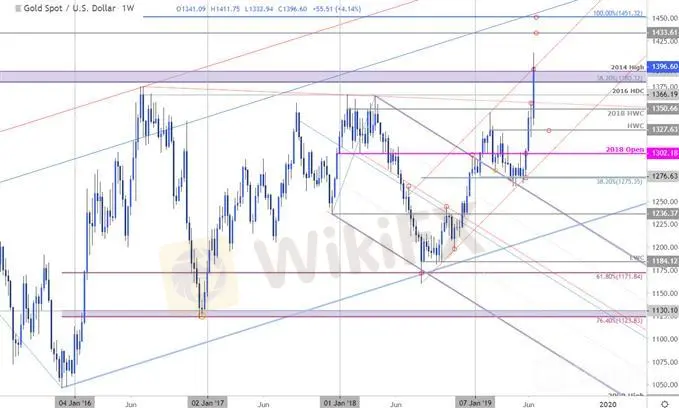
Notes: In my last Gold Price Outlook we noted that the, “The weekly opening-range is set in Gold heading into the FOMC interest rate decision later today – look for the break…. A topside breach keeps the focus on subsequent resistance objectives at the 2016 high-week close at 1366 and the 38.2% retracement / 2014 high at 1380/92 (critical).” A breakout post-Fed led the advance with the rally taking XAU/USD to fresh multi-year highs (high registered at 1411). The focus is on a weekly close heading into Friday with price now testing key resistance at 1380/92 – note that basic parallel / channel resistance converges on this zone and further highlights its technical significance.
注意:在我上一次的黄金价格展望中我们他指出,“每周开盘价将在今天晚些时候进入FOMC利率决定的黄金中设定 - 寻找突破......上行突破将重点关注2016年高点收盘时的后续阻力目标1366和38.2%的回撤/ 2014年高点1380/92(关键)。”美联储突破后领涨,随着反弹走高XAU /美元兑新的多年高位(高位于1411)。重点是每周收盘前进至周五,目前价格测试关键阻力位于1380/92 - 注意基本平行/通道阻力汇聚于该区域,并进一步凸显其技术意义。
{10}
A close above this threshold keeps the focus on subsequent topside objectives at 1433 and the 100% extension of the late-2015 advance at 1451- look for a bigger reaction there IF reached. Interim support now 1366 backed by the 2018 high-week close at 1350. Broader bearish invalidation now raised to the February high-week close at 1327.
{10}
Bottom line: The immediate focus is on a weekly close above this critical resistance zone at multi-year highs. A close above 1392 would keep the immediate long-bias viable heading into the final week of June trade. Failure here would highlight the risk for near-term exhaustion. From a trading standpoint, a good place to reduce long-exposure / raise protective stop. Ultimately, a pullback would offer more favorable entries closer to the former 2016 trendline. Ill publish an updated Gold Price Outlook once we get further clarity in near-term price action next week. Review our latest Gold 2Q forecasts for a longer-term look at the technical picture for XAU/USD prices.
底线:当前关注的是每周收盘高于这个关键阻力区的多年高点。收盘价高于1392将使即时长期偏见继续进入6月交易的最后一周。这里的失败会突显近期疲惫的风险。从交易的角度来看,这是减少长时间曝光/提高保护性停止的好地方。最终,回调将提供更接近前2016年趋势线的更有利的参赛作品。我们将在下周进一步明确近期价格行动后,发布更新的黄金价格展望。查看我们最新的黄金2Q预测,以便长期了解XAU / USD价格的技术图片。
Gold Trader Sentiment (XAU/USD)
黄金交易员情绪(XAU / USD)
{15}

A summary of IG Client Sentiment shows traders are net-long Gold - the ratio stands at +1.37 (57.8% of traders are long) – weak bearish reading
{15}
Long positions are 11.5% higher than yesterday and 6.3% higher from last week
多头头寸比昨天增加11.5%,比上周增加6.3%
Short positions are 1.3% lower than yesterday and 3.6% higher from last week
空头头寸比昨天减少1.3%,比上周增加3.6%
We typically take a contrarian view to crowd sentiment, and the fact traders are net-long suggests Gold prices may continue to fall. Traders are further net-long than yesterday & last week, and the combination of current positioning and recent changes gives us a stronger Gold price (XAU/USD) -bearish contrarian trading bias from a sentiment standpoint.
我们通常采取逆向观点来看待人群情绪,事实上交易者是净多头意味着黄金价格上涨y继续下降。交易商比昨天和上周进一步净多头,目前定位和近期变化的结合使我们的黄金价格更加强劲(XAU / USD)从情绪的角度来看,看跌逆势交易偏见。
Previous Weekly Technical Charts
以前的每周技术图表
Kiwi (NZD/USD)
新西兰元(新西兰元/美元)
Crude Oil (WTI)
原油(WTI)
Japanese Yen (USD/JPY)
日元(美元/日元)
Aussie (AUD/USD)
澳元(澳元/美元)
{26}
Euro (EUR/USD)
{26}
Swissy (USD/CHF)
Swissy(美元/瑞士法郎)
US Dollar (DXY)
美元(DXY)
--- Written by Michael Boutros, Technical Currency Strategist with DailyFX
---由DailyFX技术货币策略师Michael Boutros撰写
Miễn trừ trách nhiệm:
Các ý kiến trong bài viết này chỉ thể hiện quan điểm cá nhân của tác giả và không phải lời khuyên đầu tư. Thông tin trong bài viết mang tính tham khảo và không đảm bảo tính chính xác tuyệt đối. Nền tảng không chịu trách nhiệm cho bất kỳ quyết định đầu tư nào được đưa ra dựa trên nội dung này.
Sàn môi giới
IC Markets Global
AvaTrade
STARTRADER
FXCM
EC Markets
OANDA
IC Markets Global
AvaTrade
STARTRADER
FXCM
EC Markets
OANDA
Sàn môi giới
IC Markets Global
AvaTrade
STARTRADER
FXCM
EC Markets
OANDA
IC Markets Global
AvaTrade
STARTRADER
FXCM
EC Markets
OANDA
Tin HOT
Tin tức Forex 17/03: Sàn XM tung cơ chế mới hỗ trợ đối tác
 WikiFX
Thấy gì từ sự kiện Pi Network thu hồi hàng loạt đồng Pi khiến cộng đồng tẩy chay?
WikiFXPi Network hôm nay: Giá Pi sắp phục hồi vì một tín hiệu tích cực mới?
WikiFXTính tỷ giá hối đoái

