简体中文
繁體中文
English
Pусский
日本語
ภาษาไทย
Tiếng Việt
Bahasa Indonesia
Español
हिन्दी
Filippiiniläinen
Français
Deutsch
Português
Türkçe
한국어
العربية


Gold Price Leaps to 6-Year High on Trade War Bid, Silver Battles Resistance
Lời nói đầu:Gold continued to soar, boosted by a strong risk-off move as US-China trade relations continue to deteriorate. Silver playing catch-up and nears recent resistance.
Gold (XAU) Price, Silver Price (XAG) Analysis and Chart
Gold continues its post-FOMC rally, powered by a fresh risk-off bid.
Silver needs to break resistance for move to continue.
Q3 2019 Gold Forecast and Top Trading Opportunities
Gold Up $60 since FOMC Decision, US-China Trade Wars Drive the Move
The price of gold is up around 4% since last week‘s FOMC decision and today’s move is being fueled by a ratcheting up of trade tensions between the US and China which has sparked a global risk-off move. US President Donald Trump turned up the pressure on China last week by slapping a 10% tariff on $300 billion of Chinese imports, in addition to the 25% on $250 billion of Chinese goods already in effect. In retaliation, China has let USDCNH weaken above 7.00, to counteract the tariffs, a move that will infuriate the US and may bring further punitive action.
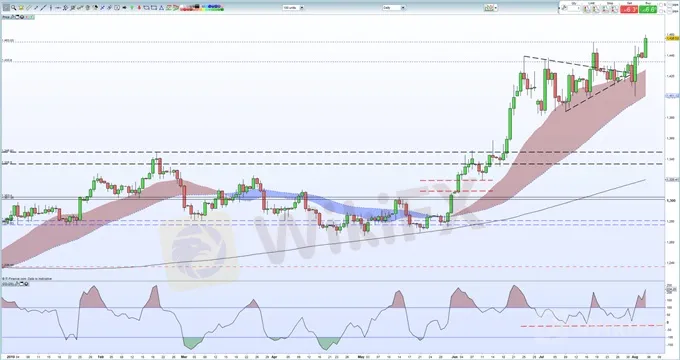
The daily gold chart continues to look positive but is also flashing a strong overbought signal which may temper any further short-term rally. Gold broke above the recent six-year high at $1,453/oz. and a close and consolidation above this level will bring the May 2013 high of $1,488/oz. into view before $1,551/oz. comes into play. Support seen between $1,433/oz. and $1,437/oz.
The DailyFX Calendar covers all important market moving data releases and events.
Gold Price Daily Chart (January - August 5, 2019)
IG Client Sentiment data show that 62.0% of retail traders are net-long of gold, a bearish contrarian indicator. However, recent daily and weekly positional changes give us a bullish contrarian bias.
How to Trade Gold: Top Gold Trading Strategies and Tips
Silver Held Back by Technical Resistance
Silvers recent sell-off has been reversed and is now looking at breaking back above recent highs and an important Fibonacci retracement level. The recent double-high at $16.65/oz. is guarded by the 61.8% retracement level at $16.57/oz. with two other intra-day highs in-between. Silver needs a break and close above $16.65/oz. before it can re-test the June 14, 2018 swing-high at $17.32/oz. A cluster of lows between $16.12/oz. and $16.17/oz. provides support.
Silver Daily Price Chart (November 2018 – August 5, 2019)

How to Trade Silver: Top Trading Strategies
Traders may be interested in two of our trading guides – Traits of Successful Traders and Top Trading Lessons – while technical analysts are likely to be interested in our latest Elliott Wave Guide.
Miễn trừ trách nhiệm:
Các ý kiến trong bài viết này chỉ thể hiện quan điểm cá nhân của tác giả và không phải lời khuyên đầu tư. Thông tin trong bài viết mang tính tham khảo và không đảm bảo tính chính xác tuyệt đối. Nền tảng không chịu trách nhiệm cho bất kỳ quyết định đầu tư nào được đưa ra dựa trên nội dung này.
Sàn môi giới
STARTRADER
TMGM
HFM
ATFX
IB
FP Markets
STARTRADER
TMGM
HFM
ATFX
IB
FP Markets
Sàn môi giới
STARTRADER
TMGM
HFM
ATFX
IB
FP Markets
STARTRADER
TMGM
HFM
ATFX
IB
FP Markets
Tin HOT
Tin tức Forex 17/03: Sàn XM tung cơ chế mới hỗ trợ đối tác
 WikiFX
Thấy gì từ sự kiện Pi Network thu hồi hàng loạt đồng Pi khiến cộng đồng tẩy chay?
WikiFXWikiFX Review sàn Forex Vantage 2025: Hành trình chinh phục trader Việt?
WikiFXPi Network và tin đồn cơ chế neo giá: Những điều bạn cần biết
WikiFXLàm sao để tránh bẫy sàn lừa đảo khi đầu tư Forex? Đây là Tips từ WikiFX
WikiFXPi Network hôm nay: Giá Pi sắp phục hồi vì một tín hiệu tích cực mới?
WikiFXPi Network hôm nay: Chuyên gia dự báo giá Pi sắp tới sẽ đạt con số kỷ lục!
WikiFXTính tỷ giá hối đoái

