简体中文
繁體中文
English
Pусский
日本語
ภาษาไทย
Tiếng Việt
Bahasa Indonesia
Español
हिन्दी
Filippiiniläinen
Français
Deutsch
Português
Türkçe
한국어
العربية


US Dollar Price Outlook: DXY Threatens Larger Recovery– Trade Targets
Lời nói đầu:A rebound in the US Dollar has price testing a near-term resistance pivot and were looking for a reaction here. These are the levels that matter on the DXY charts.
US Dollar price recovery testing near-term resistance pivot- broader risk lower sub-98.40
Check out our 2019 projections in our Free DailyFX USD Trading Forecasts
Join Michael for Live Weekly Strategy Webinars on Mondays at 12:30GMT
The US Dollar Index turned just ahead of uptrend support last week with the recent rebound threatening larger recovery in price. These are the updated targets and invalidation levels that matter on the DXY charts heading into the close of the week. Review this week's Strategy Webinar for an in-depth breakdown of this oil price setup and more.
New to Forex Trading? Get started with this Free Beginners Guide
US Dollar Price Chart – DXY Daily
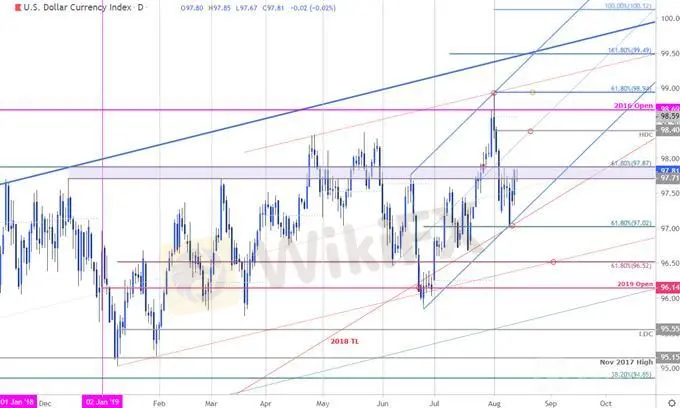
Chart Prepared by Michael Boutros, Technical Strategist; US Dollar Index on Tradingview
Technical Outlook: In my latest US Dollar Weekly Price Outlook we noted that, “DXY turned from big resistance last week and IF this pullback is the start of a larger correction, look for resistance ahead of 97.87.” Price turned just ahead of confluence support last week with the rebound now trading within the 97.71/87 resistance zone- look for a reaction here.
Why does the average trader lose? Avoid these Mistakes in your trading
US Dollar Price Chart – DXY 120min

Chart Prepared by Michael Boutros, Technical Strategist; US Dollar Index on Tradingview
Notes: A closer look at DXY price action shows the index trading within the confines of a broad ascending pitchfork formation extending off the June lows with the weekly opening-range now taking shape just below the confluence resistance at 97.87- a region defined by the 61.8% retracement of the 2017 decline and the 38.2% retracement of the August range.
A breach above this region would expose topside resistance objectives at 98.07/12 backed by the median-line / 61.8% retracement at 98.27- look for a reaction there IF reached. Ultimately a topside breach / close above the yearly high-day close at 98.40 would be needed to mark resumption of the broader up-trend. Support steady at the 97.21 with a break below 97.02 needed to suggest a more significant high was registered this month. Such a scenario would have us targeting initial support objectives at 96.52.
Learn how to Trade with Confidence in our Free Trading Guide
Bottom line: The US Dollar is testing near-term resistance here – IF broken, look for a larger recovery towards the median-line / uptrend resistance. From a trading standpoint, a good place to raise protective stops – ultimately, a larger recovery would have us looking for possible exhaustion / favorable short-entries on a stretch higher towards 98.27.
For a complete breakdown of Michaels trading strategy, review his Foundations of Technical Analysis series on Building a Trading Strategy
---
Relevant US Data Releases

Economic Calendar - latest economic developments and upcoming event risk.
Active Trade Setups
Gold Price Targets: XAU/USD at Critical Resistance – Trade Outlook
Euro Technical Price Outlook: EUR/USD Near-term Breakout Imminent
Aussie Price Outlook: Is the Australian Dollar Recovery Real?
Oil Price Outlook: Crude Spills into Support – WTI Trade Levels
Canadian Dollar Price Chart: USD/CAD Breakout Stalls at Six-Week High
Miễn trừ trách nhiệm:
Các ý kiến trong bài viết này chỉ thể hiện quan điểm cá nhân của tác giả và không phải lời khuyên đầu tư. Thông tin trong bài viết mang tính tham khảo và không đảm bảo tính chính xác tuyệt đối. Nền tảng không chịu trách nhiệm cho bất kỳ quyết định đầu tư nào được đưa ra dựa trên nội dung này.
Sàn môi giới
FP Markets
Vantage
STARTRADER
ATFX
OANDA
Exness
FP Markets
Vantage
STARTRADER
ATFX
OANDA
Exness
Sàn môi giới
FP Markets
Vantage
STARTRADER
ATFX
OANDA
Exness
FP Markets
Vantage
STARTRADER
ATFX
OANDA
Exness
Tin HOT
Tin tức Forex 17/03: Sàn XM tung cơ chế mới hỗ trợ đối tác
 WikiFX
Thấy gì từ sự kiện Pi Network thu hồi hàng loạt đồng Pi khiến cộng đồng tẩy chay?
WikiFXWikiFX Review sàn Forex Vantage 2025: Hành trình chinh phục trader Việt?
WikiFXPi Network và tin đồn cơ chế neo giá: Những điều bạn cần biết
WikiFXLàm sao để tránh bẫy sàn lừa đảo khi đầu tư Forex? Đây là Tips từ WikiFX
WikiFXPi Network hôm nay: Giá Pi sắp phục hồi vì một tín hiệu tích cực mới?
WikiFXPi Network hôm nay: Chuyên gia dự báo giá Pi sắp tới sẽ đạt con số kỷ lục!
WikiFXTính tỷ giá hối đoái

