简体中文
繁體中文
English
Pусский
日本語
ภาษาไทย
Tiếng Việt
Bahasa Indonesia
Español
हिन्दी
Filippiiniläinen
Français
Deutsch
Português
Türkçe
한국어
العربية


Gold Price Targets: XAU/USD Breakout Halted at Trend Resistance
Lời nói đầu:Gold prices ripped into multi-year trend resistance this week - the breakout is vulnerable while below. Here are the levels that matter on the XAU/USD weekly chart.
Gold price breakout testing multi-year uptrend resistance– rally vulnerable below 1526
Join Michael for Live Weekly Strategy Webinars on Mondays at 12:30GMT
Gold prices are poised to rally for a third consecutive week and would mark the eleventh advance in the past thirteen weeks. The price breakout ran into a critical resistance zone weve been tracking for months now and leaves the broader long-bias vulnerable while below up-trend resistance. These are the updated targets and invalidation levels that matter on the XAU/USD weekly price chart. Review my latestWeekly Strategy Webinar for an in-depth breakdown of this gold price setup and more.
Gold Price Chart - XAU/USD Weekly
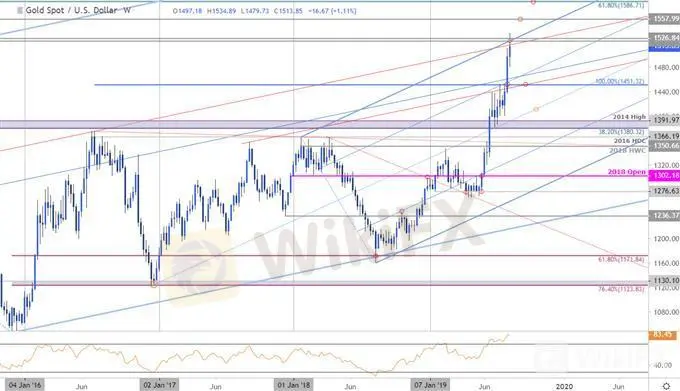
Chart Prepared by Michael Boutros, Technical Strategist; Gold on Tradingview
Notes: In my last XAU/USD PriceOutlook we noted that gold was, “testing a critical resistance confluence at 1522/26 and were looking for a reaction up here.” Price briefly registered a high at 1534 before reversing sharply with the focus now on a weekly close in relation to this key threshold. Note that weekly RSI now has momentum at the highest reading since the record 2011 high.
Weekly support remains with the 50% retracement of the decline off the record highs at 1483 backed by key support / medium-term bullish invalidation at 1451. A topside breach exposes subsequent weekly resistance objectives at 1558 and the 61.8% retracement at 1586- look for a bigger reaction there IF reached.
Bottom line: The gold breakout is testing major confluence resistance up here - watch the weekly close. The risk for a near-term pullback / correction mounts if we settle below 1526. From a trading standpoint, a good place to reduce long-exposure / raise protective stops – be on the lookout for possible exhaustion. Ultimately a larger pullback may offer more favorable entries closer to slope support. Review my latest Gold Price Outlook for a closer look at the near-term XAU/USD technical trading levels.
Even the most seasoned traders need a reminder every now and then-Avoid these Mistakes in your trading
Gold Trader Sentiment (XAU/USD)

A summary of IG Client Sentiment shows traders are net-long Gold - the ratio stands at +1.69 (62.9% of traders are long) – bearish reading
Long positions are 3.1% higher than yesterday and 9.6% higher from last week
Short positions are 1.4% higher than yesterday and 8.1% lower from last week
We typically take a contrarian view to crowd sentiment, and the fact traders are net-long suggests Spot Gold prices may continue to fall. Traders are further net-long than yesterday & last week, and the combination of current positioning and recent changes gives us a stronger Spot Gold-bearish contrarian trading bias from a sentiment standpoint.
Miễn trừ trách nhiệm:
Các ý kiến trong bài viết này chỉ thể hiện quan điểm cá nhân của tác giả và không phải lời khuyên đầu tư. Thông tin trong bài viết mang tính tham khảo và không đảm bảo tính chính xác tuyệt đối. Nền tảng không chịu trách nhiệm cho bất kỳ quyết định đầu tư nào được đưa ra dựa trên nội dung này.
Sàn môi giới
AvaTrade
GO MARKETS
EC Markets
HFM
Neex
Vantage
AvaTrade
GO MARKETS
EC Markets
HFM
Neex
Vantage
Sàn môi giới
AvaTrade
GO MARKETS
EC Markets
HFM
Neex
Vantage
AvaTrade
GO MARKETS
EC Markets
HFM
Neex
Vantage
Tin HOT
Tin tức Forex 17/03: Sàn XM tung cơ chế mới hỗ trợ đối tác
 WikiFX
Thấy gì từ sự kiện Pi Network thu hồi hàng loạt đồng Pi khiến cộng đồng tẩy chay?
WikiFXPi Network hôm nay: Giá Pi sắp phục hồi vì một tín hiệu tích cực mới?
WikiFXTính tỷ giá hối đoái

