简体中文
繁體中文
English
Pусский
日本語
ภาษาไทย
Tiếng Việt
Bahasa Indonesia
Español
हिन्दी
Filippiiniläinen
Français
Deutsch
Português
Türkçe
한국어
العربية


Gold Price Rally May Be Set to Resume Rally to Fresh 2019 Highs
Abstract:Gold prices had been on a tear up until a week ago. After moving sideways for the past several days, the rally by gold prices may be ready to resume.
Gold Price Talking Points:
Gold prices had been on a tear up until a week ago. After moving sideways for the past several days, the rally by gold prices may be ready to resume.
Softness in US Treasury yields may be helping drive gold higher as geopolitical concerns have lifted golds fundamental appeal as a safe haven asset.
Retail trader positioning is no longer dictating the conditions for a pullback in gold prices.
Looking for longer-term forecasts on Gold and Silver prices? Check out the DailyFX Trading Guides.
After a huge rally at the end of May and the beginning of June, gold prices have settled into an approximate $30 range over the past week. But its not just gold prices: volatility has cooled across the board, with bonds, currencies, equities trading in tighter ranges in recent days. Following the Mexico tariff ceasefire at the end of last week, it feels as if traders are taking a collective sigh of relief ahead of the June Fed meeting next week. Now, with most of the week in the rearview mirror, traders are looking ahead to risks around the corner.
Gold Volatility Starting to Increase Again
With the June Fed meeting next week likely to signal the end of the Fed rate hike cycle and the start of the Fed rate cut cycle, traders have started to factor in greater uncertainty around gold prices – a good sign for bullion. Whereas other asset classes don‘t like increased volatility (signaling greater uncertainty around cash flows, dividends, coupon payments, etc.), precious metals tend to benefit from periods of higher volatility as uncertainty increases the appeal of gold’s and silvers safe haven appeal.
GVZ (Gold Volatility) Technical Analysis: Daily Price Chart (June 2018 to June 2019) (Chart 1)
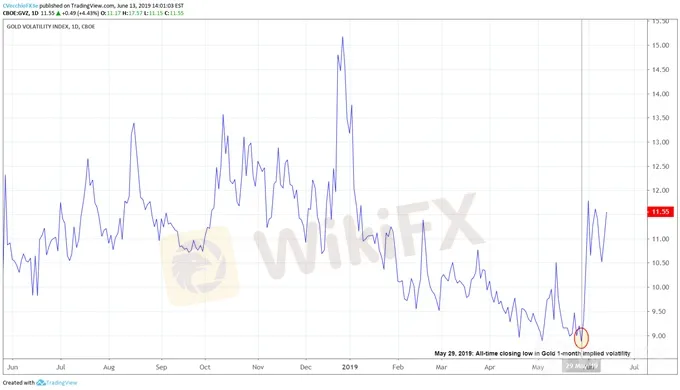
After pressing lower over the past several days, gold volatility (as measured by the Cboes gold volatility ETF, GVZ, which tracks the 1-month implied volatility of gold as derived from the GLD option chain) has moved up back towards its June high, suggests that gold prices may be facing an easier environment in the near-term.
Gold Price Pullback Mirrored Other Episodes
In the month of June, we‘ve been carefully watching the gold price rally. Last Wednesday, gold prices moved more than 2% above their daily 21-EMA for just the fifth time since the gold price bottom developed in Q3’19. In the four previous instances, gold prices averaged a 1-week return of -0.49%. As such, at the time it was noted that “the risk for exhaustion setting in again soon and cutting the rally short is increasing.”
After hitting a high of 1348.13 last Wednesday, June 5, when gold prices first moved more than 2% more than the daily 21-EMA, gold prices came down -0.81% to where they closed yesterday, Wednesday, June 12.
Gold Price Technical Analysis: Daily Chart (April 2018 to June 2019) (Chart 2)

Now that the episode where the gold price move in excess of 2% of the daily 21-EMA signaled near-term exhaustion has behaved similar to the prior four episodes, then the healthy correction in gold prices may have run its course; the longer-term uptrend is still valid.
Earlier this week it was noted that “former resistance now support appearing as the March 25 swing high at 1324.40 may be the first near-term support level followed by the daily 8-EMA at 1322.07.” Indeed, this area around 1322.07/1324.40 held, exculpatory proof that former resistance has indeed become support, confirming the series of higher highs in the process.
As such, if the near-term exhaustion condition is worked off, then the recent gold price consolidation may be coming to an end as well. With gold volatility rising once more, it seems increasingly likely that the next gold price move will be to the topside; the rally is set to continue.
A break above the 1348.31 high set on June 7 would trigger a bullish breakout, with a measured move up to a new 2019 high at 1376.39. Only a move below 1319.87, recent consolidation support, would nullify the prospective bullish outlook.
IG Client Sentiment Index: Spot Gold Price Forecast (June 13, 2019) (Chart 3)

Spot Gold: Retail trader data shows 58.2% of traders are net-long with the ratio of traders long to short at 1.39 to 1. The number of traders net-long is 1.0% higher than yesterday and 2.5% higher from last week, while the number of traders net-short is 4.8% higher than yesterday and 0.4% lower from last week.
We typically take a contrarian view to crowd sentiment, and the fact traders are net-long suggests spot gold prices may continue to fall. Positioning is less net-long than yesterday but more net-long from last week. The combination of current sentiment and recent changes gives us a further mixed spot gold trading bias.
Disclaimer:
The views in this article only represent the author's personal views, and do not constitute investment advice on this platform. This platform does not guarantee the accuracy, completeness and timeliness of the information in the article, and will not be liable for any loss caused by the use of or reliance on the information in the article.
Read more

The U.S. dollar index and U.S. Treasury yields rebounded at the same time; gold fell by more than 1%!
The initial value of the US S&P Global Manufacturing PMI in August was 48, which was lower than expected and the lowest in 8 months; the service PMI was 55.2, which exceeded the expected 54. The number of initial jobless claims in the week ending August 17 was 232,000, slightly higher than expected, and the previous value was revised from 227,000 to 228,000. Existing home sales in July increased for the first time in five months. The PMI data was lower than expected, which was bad for the US eco

The U.S. dollar index returned to the 103 mark; gold once plunged nearly $40 from its intraday high!
The monthly rate of retail sales in the United States in July was 1%, far exceeding expectations; the number of initial claims last week was slightly lower than expected, falling to the lowest level since July; traders cut their expectations of a rate cut by the Federal Reserve, and interest rate futures priced that the Federal Reserve would reduce the rate cut to 93 basis points this year. The probability of a 50 basis point rate cut in September fell to 27%. The data broke the expectation of a

Gold Price Stimulates by Geopolitical Tension
Gold prices experienced their largest gain in three weeks, driven by escalating tensions in the Middle East and the easing of the U.S. dollar as markets await the crucial CPI reading due on Wednesday. Gold has surged to an all-time high above $2,460, as uncertainties surrounding developments in both the Middle East and Eastern Europe persist push the demand for safe-haven assets higher.

KVB Today's Analysis: USD/JPY Eyes Volatility Ahead of BoJ Policy Meeting and US Data
The USD/JPY pair rises to 154.35 during the Asian session as the Yen strengthens against the Dollar for the fourth consecutive session, nearing a 12-week high. This is due to traders unwinding carry trades ahead of the Bank of Japan's expected rate hike and bond purchase tapering. Recent strong US PMI data supports the Federal Reserve's restrictive policy. Investors await US GDP and PCE inflation data, indicating potential volatility ahead of key central bank events.
WikiFX Broker
Latest News
GCash Adds USDC to GCrypto for Secure Crypto Trading in Philippines
 WikiFX
Kraken Acquires NinjaTrader for $1.5B to Lead US Futures Market
WikiFXDFA Rescues Over 100 Filipinos from Myanmar Scam Hubs
WikiFXVanishing Fortunes: RM1.9 Million Lost in a Crypto Scam
WikiFXWhat Project 2025 Means for Tariffs and Trade on April 2
WikiFXFX vs Crypto Trading: Which Strategy is Best for You in 2025?
WikiFXBOTBRO Scam revealed?
WikiFXTrade Demo, Win Real Money! Join WikiFX’s Trading Competition Now!
WikiFXAI-Driven Scams Are Targeting Your Finances—Stay Vigilant
WikiFXThai Police Arrest Yakuza Suspect in Call-Center Scam Bust
WikiFXCurrency Calculator

