简体中文
繁體中文
English
Pусский
日本語
ภาษาไทย
Tiếng Việt
Bahasa Indonesia
Español
हिन्दी
Filippiiniläinen
Français
Deutsch
Português
Türkçe
한국어
العربية
Why is China's Yuan Climbing?
Abstract:Yuan has strengthened against USD over past 15 months
Chinese high-yield bond prices have tumbled since 2021
Rising cost of credit could lead to a weaker yuan
On one side of the Pacific coast, expectations have shifted to a dramatically tighter monetary policy in U.S. On the other, the Peoples Bank of China (PBoC) continues to ease monetary policy. This might have set off expectations for the U.S. dollar to rise sharply versus the onshore and offshore Chinese yuan (CNY and CNH). But CNHUSD has strengthened slightly over the past 15 months (Figure 1).
Figure 1: Up until 2020, CNHUSD usually tracked the PBoCs monetary policy
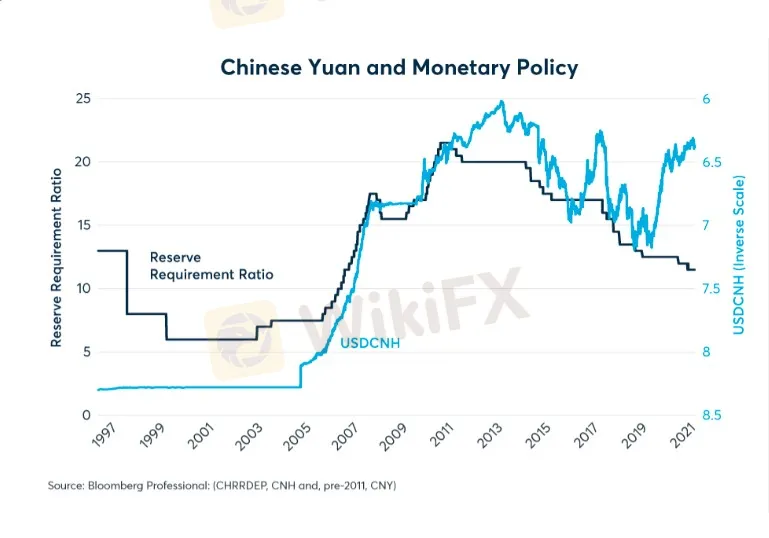
So why has the Chinese currency, which normally strengthens when the PBoC raises rates and falls when it eases, decoupled from monetary policy? The answer appears to lie in the strength of Chinas exports. Since the beginning of the pandemic, Chinese exports have risen more quickly than imports, and the resultant growth in the trade surplus appears to have supported CNH (Figure 2).
Figure 2: As demand for manufactured goods rose during the pandemic, Chinas exports surged
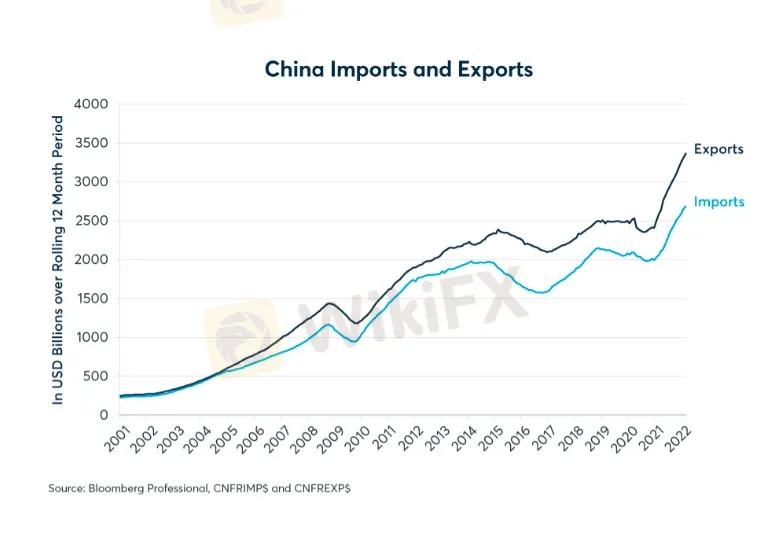
The strength of Chinese exports reflects, in part, a shift in global consumption patterns during the pandemic. Less able to spend money on experiences like restaurant meals, sporting events, movies, and travel, consumers shifted spending towards manufactured goods. In the U.S., for example, consumer spending on goods rose by 22% between December 2019 and December 2021, while spending on services rose by only 6% during the same period. China, being the worlds premier exporter of manufactured goods, benefitted disproportionately from this shift in spending.
Going forward, however, the Chinese trade picture might not continue to be as supportive for the yuan. On the one hand, consumer spending appears likely to shift back towards experiences as most of the world cautiously reopens for business. On the other hand, China‘s cost of imports might rise significantly in line with higher prices for agricultural goods, metals and energy following Russia’s invasion of Ukraine.
Up to now a widening trade surplus has helped to support China‘s currency by counteracting a relative easing of Chinese monetary policy with respect to the U.S. and other currencies where central banks have begun tightening policy. Going forward, there appears to be a growing risk that a diminishing trade surplus could begin pulling China’s currency in the same downward direction as monetary policy.
Compounding this concern is the state of China‘s domestic economy. Over the past dozen years China’s debt levels have doubled relative to the size of its economy. Since 2008, China‘s non-financial corporate debt rose from 96% to 156% of GDP, while household debt expanded from 18% to 62% of GDP, and government debt more than doubled from 28% to 68% of GDP. Overall, China’s total debt burden has risen from 141% to 284% of GDP (Figure 3).
Figure 3: Chinas debt levels have more than doubled with respect to GDP since 2008
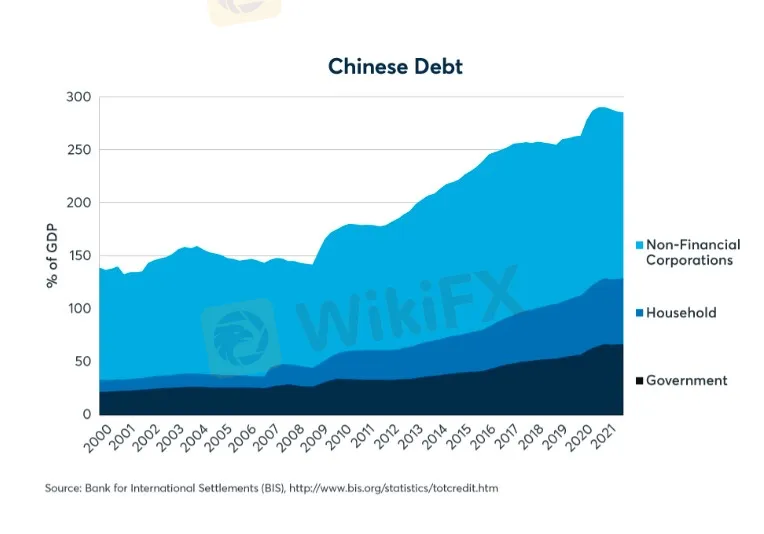
High debt levels aren‘t a problem so long as borrowers can finance the debt burden. However, there are signs that China’s corporate sector is running into significant financing challenges and that those difficulties are spreading beyond the real estate sector. Between May 2021 and March 2022 Markit iBoxxs USD China High Yield Total Return Index has fallen by 41%, implying a tremendous widening of credit spreads as China attempts to deleverage its real estate sector (Figure 4).
Figure 4: Chinese high yield bond prices have fallen 40% since May 2021.
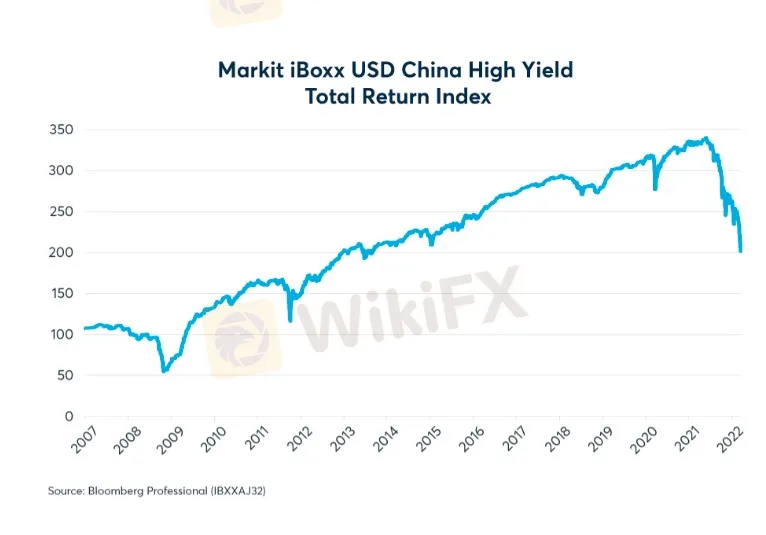
If a rising cost of credit slows China‘s growth relative to that of the U.S., it may eventually add to the downward pressure on the yuan. Exceptionally strong growth in China from 2005 to 2011 helped to put the yuan on an upward course versus USD that lasted until 2013. Then a slowdown in China’s growth from 2012 onward helped to pull the yuan lower until the early days of the pandemic. China came out of lockdown long before most other countries and its relative growth rate surged along with its currency between May 2020 and early 2021. Now a renewed period of sub-par growth in China relative to the U.S. and other nations might once again pull CNH lower (Figure 5).
Figure 5: USDCNH sometimes follows the relative growth rate between China and the U.S.
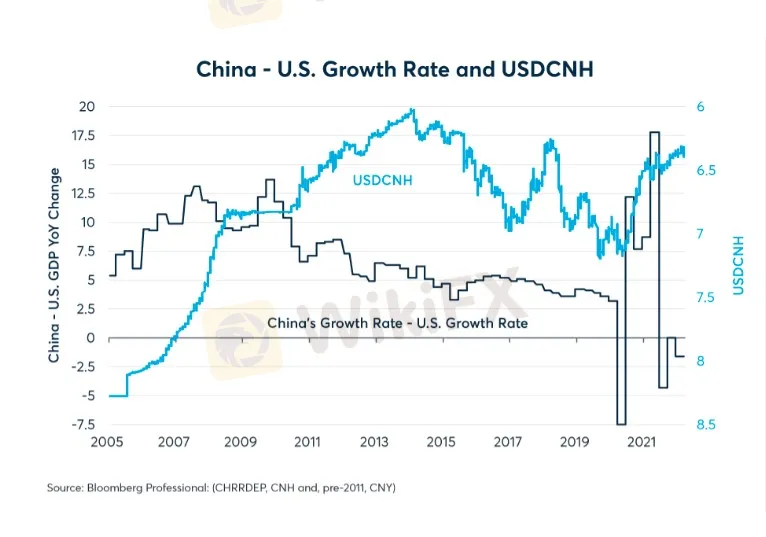
With Covid cases rising again in China, any widespread lockdown could further widen the gap between Chinas growth rates and that of the U.S., where the pandemic is now treated as an endemic.
Disclaimer:
The views in this article only represent the author's personal views, and do not constitute investment advice on this platform. This platform does not guarantee the accuracy, completeness and timeliness of the information in the article, and will not be liable for any loss caused by the use of or reliance on the information in the article.
Read more
Libertex Review 2025: Live & Demo Accounts, Withdrawal to Explore
Founded in 2012, Libertex is a Cyprus-based online broker providing both investment and trading services. They offer access to over 350 instruments, including CFDs and real stocks. Libertex has become a popular choice among retail investors, largely due to its competitive trading costs, robust trading platform, a 100% welcome bonus for new clients (subject to certain deposit requirements and trading activity), and the availability of fractional shares. However, notably, Libertex does not currently offer copy trading functionality and its educational resources are somewhat limited.
JustMarkets Review 2025: Live & Demo Accounts, Withdrawal to Explore
Established in 2012, JustMarkets (Formerly JustForex) is an online forex broker based in Cyprus and serves clients in over 160 countries. Featuring a low entry barrier, a 50% deposit bonus, and robust trading platforms -MT4 and MT5, JustMarkets has gained great popularity among retail investors in recent years. JustMarkets allows traders to trade over 260 CFD-based instruments, which is not an extensive range, yet on leverage up to 3000:1 to increase trading flexibility. To enhance the trading experience, both MT4 and MT5 are provided, along with JustMarkets Trading App, MetaTrader Mobile App, and MetaTrader WebTerminal. JustMarkets offers a 50% deposit bonus to boost traders' confidence. Opening an account is a fully online process, typically completed within one day.

Degiro Review 2025: Trading Accounts, Demo Accounts and Withdrawals to Explore
DEGIRO claims to be a popular online broker known for its competitive trading fees and a great range of investment options, including stocks, ETFs, bonds, and options. DEGIRO stands out for is its low-fee structure, often significantly cheaper than competitors, achieved by focusing on execution-only services. This, however, comes at the cost of less comprehensive research tools and educational resources compared to full-service brokers. While functional, DEGIRO's platform is considered less sophisticated, lacking advanced charting, in-depth research, and real-time news. Additionally, its customer service has been criticized for some withdrawal problems, as well as being slow to respond at times.

WikiEXPO Becomes Partner of the Liberland Government
Wiki Finance EXPO is honored to announce a partnership with the Free Republic of Liberland. This collaboration will further advance global dialogue on financial innovation and decentralized technology, bringing cutting-edge insights and industry opportunities to participants.
WikiFX Broker
Latest News
Brazilian Man Charged in $290 Million Crypto Ponzi Scheme Affecting 126,000 Investors
Become a Full-Time FX Trader in 6 Simple Steps
ATFX Enhances Trading Platform with BlackArrow Integration
Decade-Long FX Scheme Unravels: Victims Lose Over RM48 Mil
What Can Expert Advisors Offer and Risk in Forex Trading?
5 Steps to Empower Investors' Trading
How to Find the Perfect Broker for Your Trading Journey?
The Top 5 Hidden Dangers of AI in Forex and Crypto Trading
The Most Effective Technical Indicators for Forex Trading
IG 2025 Most Comprehensive Review
Currency Calculator


