简体中文
繁體中文
English
Pусский
日本語
ภาษาไทย
Tiếng Việt
Bahasa Indonesia
Español
हिन्दी
Filippiiniläinen
Français
Deutsch
Português
Türkçe
한국어
العربية


Bitcoin Forecast: BTC Probes Support, but Bulls Keep Price Afloat
Extracto:Bitcoin offered yet another test of nearby support, but a lack of follow-through may allow bulls to reclaim the level yet.
Bitcoin Price Forecast:
Bitcoin bears staged yet another run at the ascending trendline from May, but bulls have worked to rebuke the move
Without a close beneath the line, near-term bullishness is a possibility but a series of lower highs from June is not encouraging over the medium-term
Check out the DailyFX Podcast with guest Tone Vays for Bitcoin and Libra predictions. Mr. Vays specializes in Bitcoin and blockchain and was a vice president at JP Morgan Chase in the aftermath of the 2008 financial crisis
Bitcoin Forecast: BTC Probes Support, but Bulls Keep Price Afloat
Bitcoin broke beneath trendline support again on Wednesday as the coins rally continues to face headwinds. After the loss of fundamental drivers and failure to breakthrough the descending trendline from June, I have recently argued further BTC losses may be on the horizon in the short to medium term. While BTCUSD has not yet posted a close beneath the May trendline, continued tests do elicit confidence. Further, a series of lower highs from June could speak to waning confidence among bulls.
Bitcoin Price Chart: Daily Time Frame (May – August) (Chart 1)
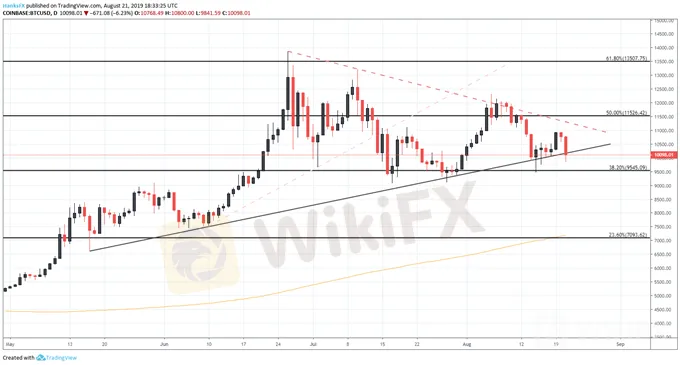
Chart created with TradingView
Despite the potential breakdown, Bitcoin is arguably in a better position now than it was in early August – from a technical perspective. Upon prior tests, the distance between the 38.2% Fibonacci level at $9,545 and the ascending trendline was minimal, which would have allowed BTCUSD to break beneath both in a single move. Now, however, Bitcoin has distanced itself from the 38.2% level and may be able to look to it for support upon a confirmed break of the trendline.
Bitcoin Price Chart: 4 – Hour Time Frame (May – August) (Chart 2)

Chart created with TradingView
If bulls reemerge and look to drive price higher, initial resistance will be offered by the 200-simple moving average on the four hour chart which has proved influential in the second-half of August. Junes descending trendline and the 50% retracement at $11,526 will look to offer secondary and tertiary barriers. At present, there seems to be few signs to suggest that Bitcoin price will immediately rebound. Until such a signal is offered, I am inclined to suspect BTC price will continue to bleed lower in the near-term.

Looking to IG Client Sentiment Data, overwhelming long exposure may suggest BTC will continue to fall as we typically view crowd sentiment as a contrarian indicator. Retail trader data shows 80.4% of traders are net-long with the ratio of traders long to short at 4.11 to 1. The number of traders net-long is 1.5% higher than Tuesday and 8.0% higher from last week, while the number of traders net-short is 4.6% lower than Tuesday and 10.7% lower from last week. As Bitcoin negotiates the rising trendline, follow
Descargo de responsabilidad:
Las opiniones de este artículo solo representan las opiniones personales del autor y no constituyen un consejo de inversión para esta plataforma. Esta plataforma no garantiza la precisión, integridad y actualidad de la información del artículo, ni es responsable de ninguna pérdida causada por el uso o la confianza en la información del artículo.
Brokers de WikiFX
últimas noticias
PU Prime amplía su oferta con nuevas acciones en MetaTrader 5.
 WikiFX
La CNMV alerta de 22 entidades no registradas.
WikiFXVT Markets Lanza VFTradings: Su Nueva Plataforma de Prop Trading.
WikiFX¿Capitalix es una estafa? Cliente pierde 50,000 USD.
WikiFX¿Vantage es un bróker seguro? Análisis 2025.
WikiFX¿Interactive brokers es un bróker seguro? Análisis 2025.
WikiFXCálculo de tasa de cambio

