简体中文
繁體中文
English
Pусский
日本語
ภาษาไทย
Tiếng Việt
Bahasa Indonesia
Español
हिन्दी
Filippiiniläinen
Français
Deutsch
Português
Türkçe
한국어
العربية


Gold Price Forecast: XAU/USD surges above $1,800 on falling US T-bond yields

Extrait:Gold advances firmly, as US-10 year T-bond yields drop ten basis points, down to 1.43%. Risk-off market sentiment boosted the prospects of the XAU/USD, as the COVID-19 omicron variant threatens to derail the economic growth. XAU/USD Technical outlook: A break above $1,807 would expose $1,815, followed by $1,834.
Gold (XAU/USD) edges high during the New York session, jumping from $1,780 daily low earlier in the day towards $1,807 at press time, amid comments of Moderna‘s CEO in an interview with the Financial Times, predicted a drop in existing vaccines efficacy, spurring a flight to safe-haven assets, as portrayed by US equity futures indices falling, ahead of the Wall Street’s open.
That boosted the prospects of the yellow metal, which has strengthened on the back of falling US T-bond yields, acting as a headwind for the greenback. The US 10-year Treasury yield is plummeting ten basis points, sitting at 1.43%, while the US Dollar Index, which measures the greenbacks value against a basket of its peers, falls sharply 0.74%, breaking below the 96.00 threshold, sitting at 95.65 at press time.
It seems that market participants are focused on the coronavirus omicron developments and its impact on the global economy. The fall in US bond yields reflects investors postures, scaling back bets of Fed hiking rates from three to two increases, depending on the ongoing COVID-19 developments.
Therefore, gold has and will keep benefitting from the abovementioned, unless data of the omicron variant show that despite being contagious, it would not be as dangerous as another COVID-19 variant.
The US macroeconomic docket so far featured the S&P/Case-Shiller Home Price Index (MoM) for September, which rose by 19,1%, more than the 19.3% expected. Meanwhile, the Chicago Purchasing Managers Index for November increased to 61.8, lower than the 67 estimated.
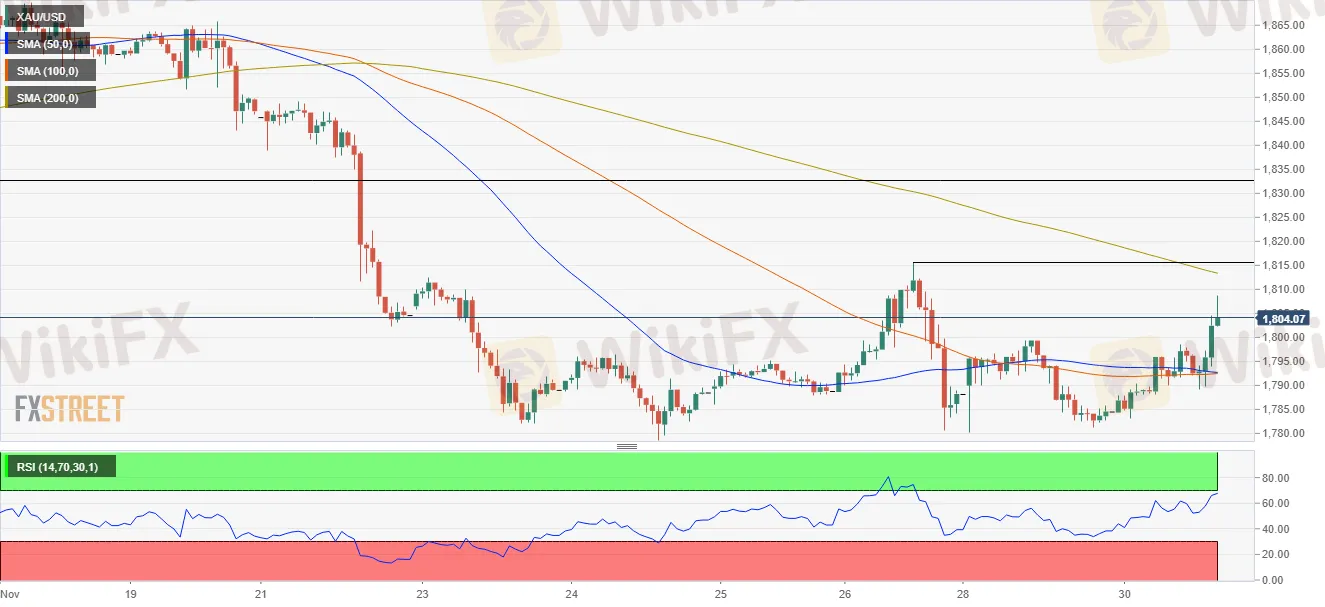
XAU/USD Price Forecast: Technical outlook
Gold in the 1-hour chart is approaching resistance at the R2 daily pivot level at $1,807. The 50 and the 100-hour simple moving averages (SMAs) were left behind around the $1,796 area, while the 200-hour SMA lies in the confluence of the R3 daily pivot at $1,815, which is also the November 26 high.
On the way up, $1,815 would be the most robust line of defense for USD bulls, which in the case to be broken, would expose the September 3 high at $1,834.
On the flip side, failure to break above the former would expose the $1,800 figure, followed by the confluence of the 50 and the 100-hour SMAs around the $1,892-94 range.
Avertissement:
Les opinions exprimées dans cet article représentent le point de vue personnel de l'auteur et ne constituent pas des conseils d'investissement de la plateforme. La plateforme ne garantit pas l'exactitude, l'exhaustivité ou l'actualité des informations contenues dans cet article et n'est pas responsable de toute perte résultant de l'utilisation ou de la confiance dans les informations contenues dans cet article.
Courtiers WikiFX
IC Markets Global
FXTM
Exness
FP Markets
FBS
HFM
IC Markets Global
FXTM
Exness
FP Markets
FBS
HFM
Courtiers WikiFX
IC Markets Global
FXTM
Exness
FP Markets
FBS
HFM
IC Markets Global
FXTM
Exness
FP Markets
FBS
HFM
Calcul du taux de change

