简体中文
繁體中文
English
Pусский
日本語
ภาษาไทย
Tiếng Việt
Bahasa Indonesia
Español
हिन्दी
Filippiiniläinen
Français
Deutsch
Português
Türkçe
한국어
العربية


Stock Market Fund Flows: S&P 500 Breaches 2,815 as Inflows Persist

एब्स्ट्रैक्ट:The S&P 500 ended Fridays session slightly above the previously insurmountable 2,815 price level. Elsewhere, utilities notched a tenth week of gains.
Stock Market Fund Flows Talking Points:
Broad-market ETFs SPY, IVV and VOO notched $11.4 billion in outflows for the week
The XLU Utilities ETF posted its tenth consecutive week of gai
Interested in equities and ETF fund flows? Sign up for the weekly webinar: Stock Market Catalysts for the Week Ahead
Stock Market Fund Flows: S&P 500 Breaches 2,815 as Inflows Persist
The S&P 500 closed above a critical level on Friday, successfully breaching resistance that held firm since early October. With the move the index notched five-month highs, closing at 2,822, the highest close since October 9th. At the same time, the broad-market exchange traded funds I cover recorded respectable inflows.
S&P 500 Price Chart: 4 – Hour Time Frame (October 2018 – March 2019) (Chart 1)
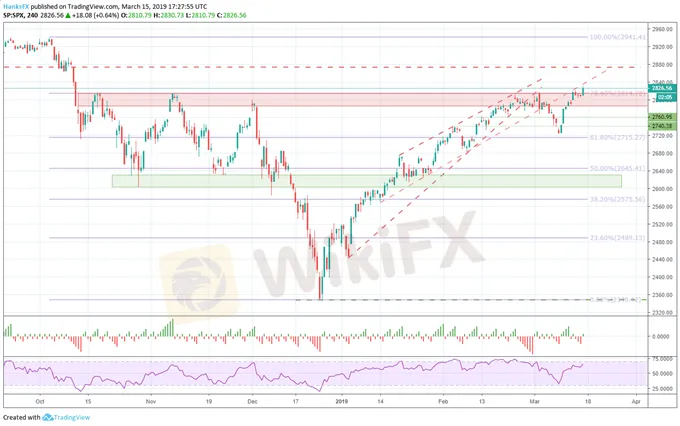
The aggregate fund flows of SPY, IVV and VOO totaled $11.4 billion this week, the largest weekly inflow since late December. IVV offered a standout performance with an intraday inflow of $4.1 billion, the largest in over a year for the ETF. While the general-market tracking funds helped the S&P 500 press higher, notable performances from generally defensive sectors assisted in the effort.
Aggregate Fund Flows for Broad Market ETFs versus S&P 500 (Chart 2)

Utilities Climb for a Tenth Week
One such performance was from the XLU ETF. The fund seeks exposure to US utility companies, typically viewed as a defensive industry due to their lack of cyclicality and tepid growth prospects. Investors seem unconcerned with the industrys investment profile as XLU closed higher Friday to notch a tenth consecutive week of gains.
XLU ETF Price Chart: Weekly Time Frame (January 2017 – March 2019) (Chart 3)

XLU ETF price chart overlaid with S&P 500 in red. Consecutive candlestick indicator highlighted. (If after-hours market movement is accounted for, this week marks just the 8th week of gains)
XLU ETF Fund Flows (Chart 4)

Learn tips and tricks to day trading the S&P 500
During the ten-week run, the fund registered $450 million in net inflows - roughly 5% of the funds $9 billion in assets under management.
Healthcare Flows Witness Volatility
While investors were determined to gain exposure in the utilities sector, another defensive sector lacked such commitment. Last week I highlighted the large inflows into the XLV healthcare ETF. This week, the fund saw considerable inflows, but was matched in earnest by outflows.
XLV ETF Fund Flows (Chart 5)

The considerable demand for healthcare appears to have been a false flag for an equity downturn. That being said, capital shifts to XLV remain extreme. In the last two weeks alone, the fund recorded four of its six largest intraday flows over the last year. While outflows have proved robust, the fund recorded $320 million in net inflows since March 4th.
In the week ahead, defensive sector performance will be important to watch as investors look to Wednesdays Fed rate decision. Should Chairman Powell strike a hawkish tone, the typical rotation into defensive sectors may be skewed by their recent strong performance and the overbought stature of XLU. With the defensive-sector landscape at present, a risk-off mood in markets could drive equity investors to shift capital into defensive assets outside the bounds of equities.
अस्वीकरण:
इस लेख में विचार केवल लेखक के व्यक्तिगत विचारों का प्रतिनिधित्व करते हैं और इस मंच के लिए निवेश सलाह का गठन नहीं करते हैं। यह प्लेटफ़ॉर्म लेख जानकारी की सटीकता, पूर्णता और समयबद्धता की गारंटी नहीं देता है, न ही यह लेख जानकारी के उपयोग या निर्भरता के कारण होने वाले किसी भी नुकसान के लिए उत्तरदायी है।
WikiFX ब्रोकर
रेट की गणना करना

