简体中文
繁體中文
English
Pусский
日本語
ภาษาไทย
Tiếng Việt
Bahasa Indonesia
Español
हिन्दी
Filippiiniläinen
Français
Deutsch
Português
Türkçe
한국어
العربية


Gold Price - Eyes a Fresh One-Month High on Risk-Off Bid

एब्स्ट्रैक्ट:The Gold rally off the low seen earlier this month continues unabated, refuelled by growing concerns that the gloomy global economic outlook may last for longer.
Gold Price Analysis and News
Gold pushes higher on risk-off bid.
US dollar remains the best of a bad bunch.
DailyFX Gold Landing Page – Prices, Charts, Analysis and Real-Time News
Gold currently trades either side of $1,317/0z. just off its highest level this month, as equity markets fall on renewed economic growth fears. The risk-off bid has pushed gold into overbought territory (CCI indicator) but any set-backs may well offer a fresh opportunity to re-enter a Gold position, especially if the recent set of higher lows hold.
Fears over an economic slowdown returned at the end of last week with the US Treasury yield curve inverting not just between 2s-10s but also between 3-month T-bills and 10-year Treasurys. Yield curve inversion is seen as a major recessionary warning signal and this will likely spell trouble for the US dollar which is currently trading as the best of a bad bunch, due to its positive yield advantage over most of its peers. The greenback is also benefitting from a raft of bad economic news in the Euro-Zone and the ongoing Brexit malaise in the UK.
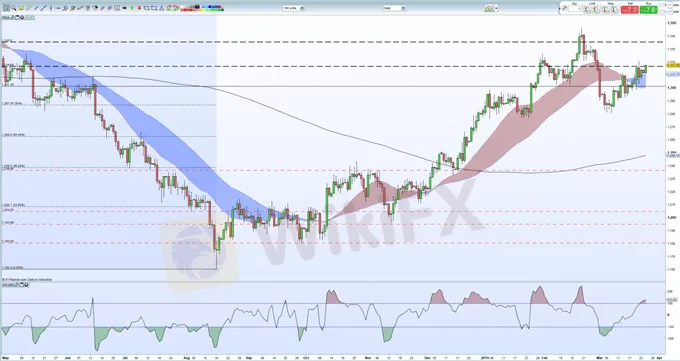
The daily Gold chart remains positive but, as pointed out before, is looking overbought in the short-term. The precious metal trades above all three moving averages and comfortably above the 61.8% Fibonacci retracement level at $1,287/oz. There are various near-term support levels all the way back down to the psychological $1,300/oz. level which should likely hold in the current risk-off environment. To the upside, a break above last Thursday‘s $1,320.8/oz. level opens an old $1,326/oz. swing-high ahead of this year’s high print at $1,347/oz.
How to Trade Gold: Top Gold Trading Strategies and Tips.
Gold Chart Daily Time Frame (May 2018 – March 25, 2019)
IG Client Sentiment shows that retail traders are 74.2% net-long of Gold, a bearish contrarian indicator. However, recent daily and weekly positional changes suggest a mixed Gold trading bias.
अस्वीकरण:
इस लेख में विचार केवल लेखक के व्यक्तिगत विचारों का प्रतिनिधित्व करते हैं और इस मंच के लिए निवेश सलाह का गठन नहीं करते हैं। यह प्लेटफ़ॉर्म लेख जानकारी की सटीकता, पूर्णता और समयबद्धता की गारंटी नहीं देता है, न ही यह लेख जानकारी के उपयोग या निर्भरता के कारण होने वाले किसी भी नुकसान के लिए उत्तरदायी है।
WikiFX ब्रोकर
रेट की गणना करना

