简体中文
繁體中文
English
Pусский
日本語
ภาษาไทย
Tiếng Việt
Bahasa Indonesia
Español
हिन्दी
Filippiiniläinen
Français
Deutsch
Português
Türkçe
한국어
العربية


Gold Price Analysis: Sitting on Support, Will it Hold?

एब्स्ट्रैक्ट:Gold is sitting on a noted technical support level and needs to hold this if the recent sell-off is to be reversed. US data during the week will guide the next move, culminating with the latest NFP release on Friday.
Gold Price Analysis, News and Pivot Points.
黄金价格分析,新闻和枢轴点。
Gold remains weak and sits on 61.8% Fibonacci retracement.
黄金仍然疲弱,位于61.8 %斐波那契回撤。
US Treasury yields pick-up boosting the US dollar.
美国国债收益率回升提振美元。
DailyFX Gold Landing Page – Prices, Charts, Analysis and Real-Time News
DailyFX黄金登陆页面 - 价格,图表,分析和实时新闻
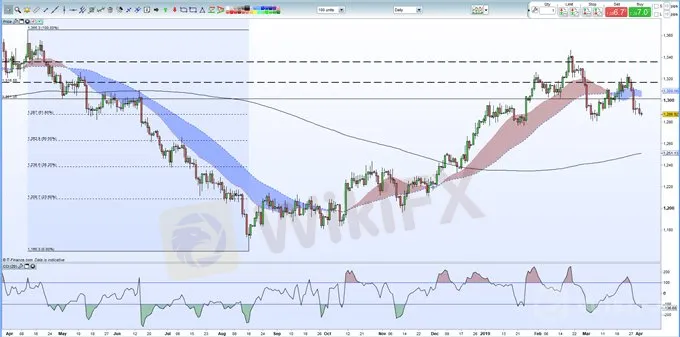
Gold continues to remain at multi-day lows and is straddling a strong technical level that needs to hold if the precious metal is to re-coup any of its recent losses. The precious metal is currently trading around $1,286.5/oz. just a tick below the 61.8% Fibonacci retracement level at $1,287/oz. of the April – August 2018 sell-off. There are also various horizontal support levels between $1,276/oz. and $1,285/oz. which may slow down any further sell-off. Below here the 50% Fibonacci retracement at $1,262.8/oz. and the 200-day moving average currently at $1,251/oz.
黄金继续维持在多日低点,跨越强大的技术水平如果贵金属要重新发动任何最近的损失,这需要持有。贵金属目前的交易价约为1,286.5美元/盎司。只需低于61.8%斐波拉契回撤位,即1,287美元/盎司。 2018年4月至8月的抛售。还有各种水平支撑位在1,276美元/盎司之间。和1,285美元/盎司。这可能会减缓任何进一步的抛售。下方50%斐波那契回撤位于1,262.8美元/盎司。目前的200日均线为1,251美元/盎司。
The chart is looking oversold in the short-term with the CCI indicator around -138 which may provide some support in the next few days. To the upside, $1,300/oz. ahead of $1,302/0z and $1,308/oz. the 20- and 50-day moving averages.
该图表在短期内看起来超卖,CCI指标在-138附近可能会提供一些支撑。接下来的几天。上涨至1,300美元/盎司。领先于$ 1,302 / 0z和$ 1,308 / oz。 20天和50天的移动平均线。
{6}
There are various US economic releases over the next few days which will steer the US dollar, and with-it gold, finishing with the latest US Labour Report (NFP) on Friday. US Treasury yields have started to pick-up this week, after slumping to, or near, multi-month lows last week and Fridays jobs and wages report will be watched closely to see if the jobs growth can continue.
{6}
US Dollar Weekly Technical Outlook; USD Starting to Look Exhausted.
美元每周技术展望;美元开始疲惫不堪。
How to Trade Gold: Top Gold Trading Strategies and Tips.
如何交易黄金:顶级黄金交易策略和提示。
Gold Chart Daily Time Frame (April 2018 – April 2, 2019)
黄金图表每日时间框架( 2018年4月 - 2019年4月2日)

IG Client Sentiment shows that retail traders are heavily net-long of Gold, a bearish contrarian indicator.
IG客户情绪显示零售交易商净多头黄金一个看跌的逆势指标。
--- Written by Nick Cawley, Market Analyst
---市场分析师Nick Cawley撰写
अस्वीकरण:
इस लेख में विचार केवल लेखक के व्यक्तिगत विचारों का प्रतिनिधित्व करते हैं और इस मंच के लिए निवेश सलाह का गठन नहीं करते हैं। यह प्लेटफ़ॉर्म लेख जानकारी की सटीकता, पूर्णता और समयबद्धता की गारंटी नहीं देता है, न ही यह लेख जानकारी के उपयोग या निर्भरता के कारण होने वाले किसी भी नुकसान के लिए उत्तरदायी है।
WikiFX ब्रोकर
रेट की गणना करना

