简体中文
繁體中文
English
Pусский
日本語
ภาษาไทย
Tiếng Việt
Bahasa Indonesia
Español
हिन्दी
Filippiiniläinen
Français
Deutsch
Português
Türkçe
한국어
العربية


Gold Price Outlook Positive, Silver Price Continues to Struggle

एब्स्ट्रैक्ट:Gold has slipped back from its recent 14-month high, but the chart remains positive ahead of this Wednesday‘s FOMC meeting. Silver’s move above $15 may prove fleeting.
Gold Price/Silver Price, Analysis and Charts.
黄金价格/白银价格,分析和图表。
Gold has turned lower, buffeted by a strong US dollar
黄金价格已走低,受强势美元冲击
Silver unable to convincingly break the 200-day moving average.
白银无法令人信服地突破200日移动均线。
DailyFX Q2 USD and Gold Forecasts and Top 2019 Trading Opportunities.
DailyFX Q2美元和黄金预测以及2019年的顶级交易机会。
Gold Slips Ahead of FOMC Rate Talk
Gold has been unable to hold its recent 14-month high and is drifting back towards minor support around $1335/oz. after a Friday rebound in the US dollar. The greenback remains the primary driver for gold and this Wednesdays FOMC meeting will be closely followed for any further talk on the timing of US interest rate cuts. The Fed is fully expected to indicate a 0.25% rate cut at the July meeting, and if this expectation is missed, the US dollar may rally further, weighing on the price of gold.
黄金未能保持近期的14个月高点并且正在向1335美元/盎司左右的小幅支撑位漂移。在周五美元反弹之后。美元仍然是黄金的主要推动因素,本周三的联邦公开市场委员会会议将密切关注美国降息的时机。预计美联储将在7月会议上降息0.25%,如果错过这一预期,美元可能会进一步上涨,从而对黄金价格造成压力。
DailyFX senior currency strategist John Kicklighter will be running Live Coverage of the FOMC Rate Decision on Wednesday from 17.45 GMT.
DailyFX高级外汇策略师John Kicklighter将于格林威治标准时间17.45周三开始实施FOMC利率决定的现场报道。
DailyFX Economic Calendar
DailyFX经济日历
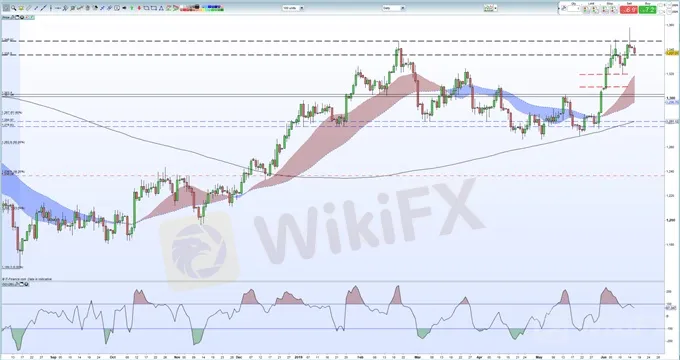
The daily gold chart shows that all three moving remain bullish, while the precious metal has also moved out of overbought territory, after its recent extreme levels. The gap on the June candle has proved supportive for now and gold is likely to make a fresh attempt at the April 11, 2018 high at $1,365/oz. if Fed Chair Powell talks rate cuts on Wednesday.
{10}
How to Trade Gold: Top Gold Trading Strategies and Tips
{10}
Gold (XAU) Daily Price Chart (August 2018 – June 17, 2019)
黄金(XAU)每日价格图表(2018年8月 - 2019年6月17日)
IG Client Sentimentshows that retail traders are 57.5% net-long gold, a bearish contrarian indicator. Recent daily and weekly sentiment shifts however give us a stronger bearish contrarian trading bias.
Silver Struggles with the 200-Day Moving Average
与200天移动平均线的银色斗争
Silvers recent break above $15.00 did not for long as the 200-day moving average, currently around $15.05, continues to act as strong resistance to a move higher. Silver has broken above the longer-dated moving average three times in the last two weeks but has been unable to close above the 200-dma. While this remains the case, silver will struggle to press higher.
银子最近突破以上由于200日移动平均线(目前在15.05美元附近)仍然坚挺阻力位上涨,因此15.00美元没有多久。在过去两周内,白银曾三次突破长期移动平均线,但未能收于200日移动均线上方。虽然事实仍然如此,但白银仍难以向更高的方向发展。
Silver Daily Price Chart (September 2018 – June 17, 2019)
白银每日价格走势图(2018年9月 - 2019年6月17日)

The gold/silver ratio continues its long-term move higher and is currently just over 90, a level last seen in March 1993.
黄金/白银比率延续其长期走高,目前刚刚超过90,最后一次见于1993年3月。

अस्वीकरण:
इस लेख में विचार केवल लेखक के व्यक्तिगत विचारों का प्रतिनिधित्व करते हैं और इस मंच के लिए निवेश सलाह का गठन नहीं करते हैं। यह प्लेटफ़ॉर्म लेख जानकारी की सटीकता, पूर्णता और समयबद्धता की गारंटी नहीं देता है, न ही यह लेख जानकारी के उपयोग या निर्भरता के कारण होने वाले किसी भी नुकसान के लिए उत्तरदायी है।
WikiFX ब्रोकर
WikiFX ब्रोकर
रेट की गणना करना

