简体中文
繁體中文
English
Pусский
日本語
ภาษาไทย
Tiếng Việt
Bahasa Indonesia
Español
हिन्दी
Filippiiniläinen
Français
Deutsch
Português
Türkçe
한국어
العربية


S&P 500 Forecast: Stocks Rebound, but will the Recovery Continue?
Ikhtisar:After plummeting at the open, the S&P 500 mounted a relief effort during Wednesday trading to eventually close in the green. While the rebound was encouraging, can it surmount nearby resistance?
S&P 500 Outlook:
As the initial shock of an abrupt trade war escalation fades, uncertainty is still heightened as evidenced by a surge in safe havens like gold and US treasuries
That said, stocks were able to rebound from initial losses on Wednesday, posting a second day of gains after it sank nearly 3%
Check out the DailyFX Podcast with Andrew Milligan, head of global strategy at Aberdeen Standard Investments
S&P 500 Forecast: Stocks Rebound, but will the Recovery Continue?
The S&P 500 opened Wednesday trading well beneath Tuesdays close and drilled even lower in the early hours of the session as the risk aversion was mirrored in gold and US treasuries which surged to their highest levels in years. That said, the selloff was short lived as the S&P 500 and other stocks began to regain their footing as the day progressed.
S&P 500 Price Chart: Daily Time Frame (Chart 1)
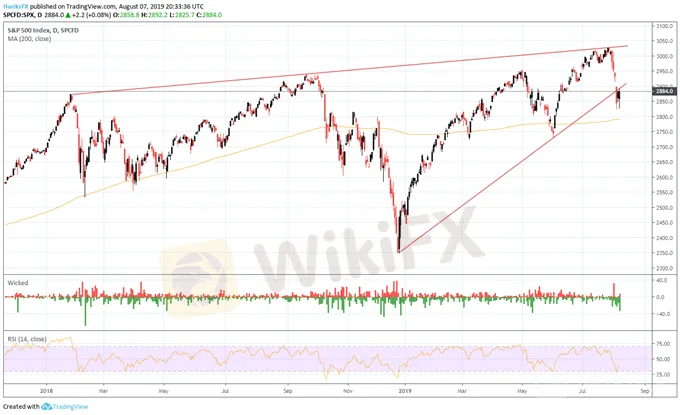
Consequently, the S&P 500 closed Wednesday trading 0.08% higher alongside a 0.4% gain in the Nasdaq and a -0.1% loss for the Dow Jones. Trading roughly 2% lower at its trough, a recovery of this magnitude saw the S&P 500 post its largest lower wick since May 10. Apart from the May recovery, Wednesdays rebound offered the longest lower wick since December 27. For the Dow Jones, the 370-point rebound was the largest since December 10.
Unfamiliar with past trade wars? Check out our guide,ABrief History of Trade Wars.
Evidently, some traders are comfortable with the depth of declines exhibited on Friday and Monday as they now look to purchase shares at a discount. On the other hand, some investors are warning that the knife may continue to fall. As always, the battle of the bulls and the bears rages on, but the fundamental forces behind the initial move still remain and technical resistance now stands in the way of a continuation higher. To that end, RSI on the S&P 500 has crept out of oversold territory and the Index resides narrowly beneath the ascending trendline from late December and May.
S&P 500 Price Chart: Hourly Time Frame (Chart 2)

If the rebound is to continue, bulls will have to surmount the trendline around 2,885 before they can set their sights higher. Personally, I think It would be presumptuous to say stocks have entirely come to terms with the newest tranche of tariffs. Further, IG Client Sentiment Data reveals that retail traders have reduced their short exposure but remain net short the S&P 500.

Retail trader data shows 35.2% of traders are net-long with the ratio of traders short to long at 1.84 to 1. The number of traders net-long is 11.9% lower than Tuesday and 14.2% higher from last week, while the number of traders net-short is 1.7% higher than Tuesday and 28.7% lower from last week.
As price action unfolds, follow @PeterHanksFX for updates and analysis on the fundamental and technical factors impacting the S&P 500.
While we typically view IG Client Sentiment data as a contrarian indicator, the fact that continue to shed their short exposure could suggest the selling is not over. In May for instance, traders were overwhelmingly short the S&P 500 and reduced their short positions after the Index declined in the middle of the month. That shift in positioning preceded subsequent losses that occurred as the calendar ticked over into June. Whether history will repeat itself is yet to be seen, but traders should be wary of an immediate recovery to all-time highs.
Disclaimer:
Pandangan dalam artikel ini hanya mewakili pandangan pribadi penulis dan bukan merupakan saran investasi untuk platform ini. Platform ini tidak menjamin keakuratan, kelengkapan dan ketepatan waktu informasi artikel, juga tidak bertanggung jawab atas kerugian yang disebabkan oleh penggunaan atau kepercayaan informasi artikel.
WikiFX Broker
Berita Terhangat
Penipuan Karyawan PEMAKAMAN Modus Investasi Forex Kerugian US$ 250,000
 WikiFX
Kembalinya MetaTrader 5 Ke Perusahaan Prop Broker Funding Pips
WikiFXMenangkan Hingga $200 dalam Acara Eksklusif WikiFX untuk Indonesia !
WikiFXPlatform Futu Catat Rekor ! Volume Perdagangan Melonjak 86,8%, Laba Bersih US$240,7 juta
WikiFXPanduan WikiFX: Cara Menghindari Risiko dari Broker Ilegal dalam Investasi Forex
WikiFXNilai Tukar

