简体中文
繁體中文
English
Pусский
日本語
ภาษาไทย
Tiếng Việt
Bahasa Indonesia
Español
हिन्दी
Filippiiniläinen
Français
Deutsch
Português
Türkçe
한국어
العربية


Silver Price Outlook: XAG/USD Breakout Testing Uptrend Resistance
Ikhtisar:Silver prices surged nearly 30% off the May lows with the rally now probing critical resistance. Here are the levels that matter on the XAG/USD weekly chart.
Silver price breakout testing confluence up-trend resistance- longs vulnerable sub-18.65
Join Michael for Live Weekly Strategy Webinars on Mondays at 12:30GMT
Silver prices have surged nearly 30% of the May lows with the breakout now probing a critical resistance confluence at fresh two-year highs. These are the updated targets and invalidation levels that matter on the XAG/USD weekly price chart heading into the close of August trade. Review my latest Weekly Strategy Webinar for an in-depth breakdown of this Silver price setup and more.
Silver Price Chart - XAG/USD Weekly
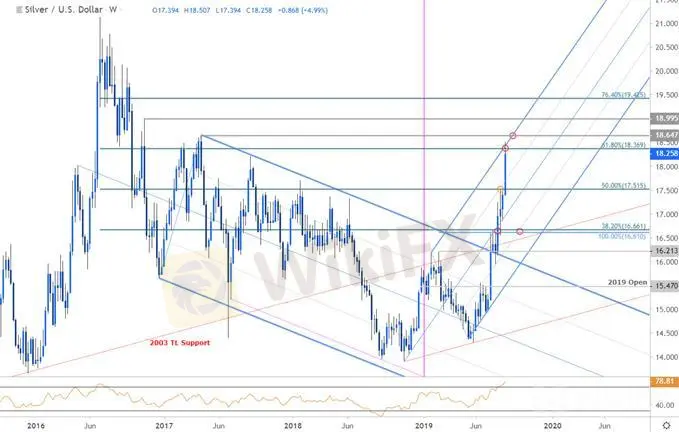
Chart Prepared by Michael Boutros, Technical Strategist; Silver on Tradingview
Notes: In my previous Silver Price Weekly Outlook we noted that XAG/USD was “approaching the first major resistance hurdle at 16.61/66 – a breach / weekly close above is needed to keep the long-bias viable targeting 17 and beyond.” A topside breach two weeks later fueled the next leg higher in price with silver now probing a more significant resistance confluence at 18.37 (high registered at 18.50 before pulling back). This region is defined by the 61.8% retracement of the 2016 decline with the upper parallel of the ascending pitchfork formation weve been tracking off the 2018 low - just higher.
A topside breach / weekly close above the 2017 swing high at 18.65 is needed to validate a breakout with such a scenario keeping the focus on subsequent topside resistance objectives at the 19-handle and the 76.4% retracement at 19.42. Initial weekly support now back at the 75% parallel (currently ~17.70s) backed b 17.52. Broader bullish invalidation now raised to 16.61/66.
For a complete breakdown of Michaels trading strategy, review his Foundations of Technical Analysis series on Building a Trading Strategy
Bottom line: Silver prices are testing uptrend resistance around 18.37/65 - a breach / close above this region is needed to keep the broader long-bias viable. From a trading standpoint, a good zone to reduce long-exposure / raise protective stops – look for evidence of price exhaustion up here. Ultimately, a larger decline may offer more favorable long-entries closer to trend support. Ill publish an updated Silver Price Outlook once we get further clarity on the near-term technical levels in XAG/USD.
Even the most seasoned traders need a reminder every now and then- Avoid these Mistakes in your trading
Silver Trader Sentiment - XAG/USD

A summary of IG Client Sentiment shows traders are net-long Silver (XAG/USD) - the ratio stands at +4.39 (81.4% of traders are long) – bearish reading
Long positions are 2.2% lower than yesterday and 3.1% lower from last week
Short positions are 18.6% higher than yesterday and 63.9% higher from last week
We typically take a contrarian view to crowd sentiment, and the fact traders are net-long suggests Spot Silver prices may continue to fall. Yet traders are less net-long than yesterday & compared with last week. Recent changes in sentiment warn that the current Spot Silver price trend may soon reverse higher despite the fact traders remain net-long.
See how shifts in Silver retail positioning are impacting trend- Learn more about sentiment!
---
Previous Weekly Technical Charts
Crude Oil (WTI)
Sterling (GBP/USD)
Gold (XAU/USD)
Canadian Dollar (USD/CAD)
US Dollar (DXY)
Disclaimer:
Pandangan dalam artikel ini hanya mewakili pandangan pribadi penulis dan bukan merupakan saran investasi untuk platform ini. Platform ini tidak menjamin keakuratan, kelengkapan dan ketepatan waktu informasi artikel, juga tidak bertanggung jawab atas kerugian yang disebabkan oleh penggunaan atau kepercayaan informasi artikel.
WikiFX Broker
WikiFX Broker
Berita Terhangat
Penipuan Karyawan PEMAKAMAN Modus Investasi Forex Kerugian US$ 250,000
 WikiFX
Kembalinya MetaTrader 5 Ke Perusahaan Prop Broker Funding Pips
WikiFXMenangkan Hingga $200 dalam Acara Eksklusif WikiFX untuk Indonesia !
WikiFXPlatform Futu Catat Rekor ! Volume Perdagangan Melonjak 86,8%, Laba Bersih US$240,7 juta
WikiFXNilai Tukar

