简体中文
繁體中文
English
Pусский
日本語
ภาษาไทย
Tiếng Việt
Bahasa Indonesia
Español
हिन्दी
Filippiiniläinen
Français
Deutsch
Português
Türkçe
한국어
العربية


Spot Gold Price Chart Shows Parabolic Climb Amid Plummeting Yields
요약:XAUUSD eclipsed the $1,320 price level as investor concern over slowing global growth has led to a collapse in long-term interest rates and another inversion along the US Treasury yield curve.
SPOT GOLD PRICE – TALKING POINTS
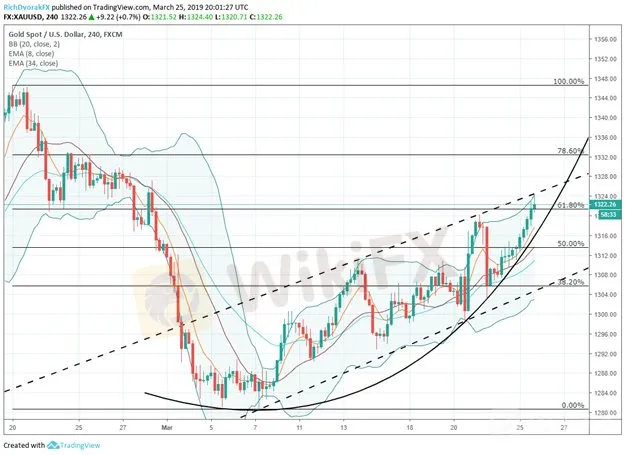
Gold jumped to $1,324 while the US 10-Year Treasury Yield dropped to its lowest level since December 2017
The recent ascent in XAUUSD appears to be driven by investors piling back into the anti-risk asset in response to a deteriorating global growth narrative
New to trading gold or looking to sharpen your gold trading skills? Check out this insight covering Top Gold Trading Strategies and Tips
The price of gold has risen to its highest level since February and pushed XAUUSD month-to-date performance back into positive territory. Gold has gained nearly 2 percent since prices based on March 7 as global growth forecasts continue to be revised lower. The Federal Reserve stoked the markets latest flare-up of pessimism last Wednesday when the FOMC released updated economic projections that cut 2019 GDP growth estimates from 2.3 percent to 2.1 percent.
SPOT GOLD (XAUUUSD) PRICE CHART: 4-HOUR TIME FRAME (FEBRUARY 19, 2019 TO MARCH 25, 2019)
Although equity investors initially celebrated the Feds latest dovish position and easy-money monetary policy, risk assets have since come under pressure as markets attempt to gauge whether the economic slowdown is temporary or if a recession is right around the corner. It appears that sentiment is souring, however, judging by soaring US Treasuries. In fact, the yield on US 10-Year Treasury Notes plummeted from a high of 2.63 percent last week down to 2.42 percent today – its lowest level since December 2017.
Moreover, CME data shows the futures market is now pricing in a 75 percent chance that the Fed cuts its policy interest rate by the end of this year. A lower yield trajectory puts pressure on real interest rates which in turn boosts the relative attractiveness of holding gold considering the precious metal is a zero-yielding asset.
SPOT GOLD (XAUUSD) VS US 10-YEAR TREASURY YIELD PRICE CHART: DAILY TIME FRAME (DECEMBER 31, 2018 TO MARCH 25, 2019)

Although long-term rates have dropped significantly, a non-parallel shift in the yield curve – a 'flattening' where short-end rates are rising faster than long-end rates – hascaused portions of the US Treasury yield curve to invert. Notably, the 3m10s yield curve just inverted and is significant due to this event signaling a recession in the US within the next 24 months seven out of the last 7 times.
Consequently, this combination of lower long-term interest rates and increasing recession risk has bolstered gold prices. Now with XAUUSD looking like it has reasserted its claim above technical support near the $1,300 price level, the recent parabolic climb has potential to continue. Nonetheless, gold bulls could quickly exit speculative positions and send spot prices lower if global economic fundamentals start to improve from current expectations.
- Written by Rich Dvorak, Junior Analyst for DailyFX
면책 성명:
본 기사의 견해는 저자의 개인적 견해일 뿐이며 본 플랫폼은 투자 권고를 하지 않습니다. 본 플랫폼은 기사 내 정보의 정확성, 완전성, 적시성을 보장하지 않으며, 개인의 기사 내 정보에 의한 손실에 대해 책임을 지지 않습니다.
WikiFX 브로커
최신 뉴스
WikiFX "3·15 외환 권리 보호의 날" – 블랙리스트 공식 발표
 WikiFX
제1회 WikiFX Korea 모의 투자 대회 시작! 벚꽃이 흩날리는 봄, WikiFX와 함께
WikiFX환율 계산기

