简体中文
繁體中文
English
Pусский
日本語
ภาษาไทย
Tiếng Việt
Bahasa Indonesia
Español
हिन्दी
Filippiiniläinen
Français
Deutsch
Português
Türkçe
한국어
العربية


Tech Sector: Highest Ratio to the S&P 500 Since Dot-Com Bubble
요약:The S&P 500 tech sector has pressed to new heights. Meanwhile, trading volume for the index reached a 5-month low ahead of tomorrows central bank double-header.
Tech Sector Talking Points:
The XLK ETF currently trades at its highest level ever and closed Mondays session with the largest share of the S&P 500 since January 2001
The S&P 500 is within reach of all-time highs heading into Wednesdays release of FOMC meeting minutes
Learn to utilize IG Client Sentiment Data effectively with one of our many Live Sentiment Data Walkthroughs.
Tech Sector: Highest Ratio to the S&P 500 Since Dot-Com Bubble
The tech sector continued its history of outperformance this week, as the XLK ETF reached record highs. Compared to the S&P 500, the sector boasts its highest ratio versus the index since the latter half of the dot-com bubble burst in January 2001. On a single stock basis, Apple once again approaches a $1 trillion valuation just months after it revised growth forecasts lower and spurred a UDSJPY flash crash.
S&P 500 Price Chart: Monthly Time Frame (August 1999 – April 2019) (Chart 1)
{8}
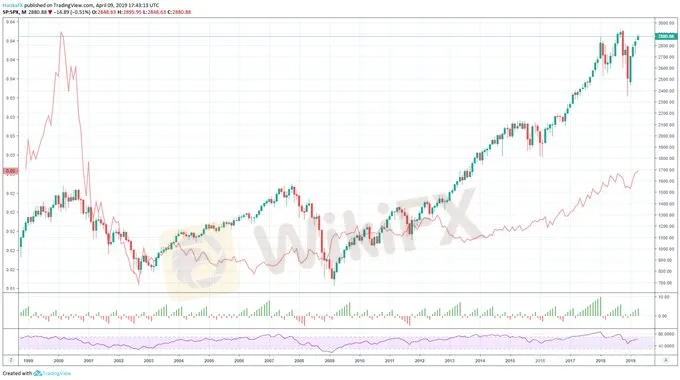
XLK/S&P 500 ratio overlaid in red
{8}
With the index itself grasping to recapture record levels, the strength of the current rally looks to be waning amid mounting headwinds ahead of Wednesday‘s FOMC meeting minutes. Global growth concerns, trade war fears and earnings season jitters have all sought to derail investor sentiment just as some of the index’s favorite names have reclaimed their luster. Wednesdays Fed minutes and a corresponding ECB policy decision may carry enough weight to deliver a meaningful shift in sentiment.
View our Economic Calendar for FOMC meeting minutes and ECB rate decisions.
Tuesdays “calm before the storm” tepidness was reflected in low trading volume (the lowest for the index in five months) for the S&P 500 and a slight increase in the VIX. Elsewhere, anticipation for the events was reflected in heightened implied volatility across several currency pairs – especially EURUSD.
S&P 500 Price Chart: Daily Time Frame (November 2018 – April 2019) (Price Chart 2)

Overlaid with CBOE Volatility index (VIX) in blue
Given the nature of the events and increased liquidity and leverage offered in the currency market, it may be a more appropriate space to explore trading opportunities ahead of tomorrow‘s event risk - even with cracks in the S&P 500’s armor.
Fresh quarterly forecasts are out! View Q2 forecasts for the S&P 500, US Dollar, British Pound and more.
--Written by Peter Hanks, Junior Analyst for DailyFX.com
{17}
Contact and follow Peter on Twitter @PeterHanksFX
{17}
Read more: Emerging Markets Crisis Monitor - Seven Factors Traders Should Watch
DailyFX forecasts on a variety of currencies such as the US Dollar or the Euro are available from the DailyFX Trading Guides page. If you‘re looking to improve your trading approach, check out Traits of Successful Traders. And if you’re looking for an introductory primer to the Forex market, check out our New to FX Guide.
면책 성명:
본 기사의 견해는 저자의 개인적 견해일 뿐이며 본 플랫폼은 투자 권고를 하지 않습니다. 본 플랫폼은 기사 내 정보의 정확성, 완전성, 적시성을 보장하지 않으며, 개인의 기사 내 정보에 의한 손실에 대해 책임을 지지 않습니다.
WikiFX 브로커
최신 뉴스
WikiFX "3·15 외환 권리 보호의 날" – 블랙리스트 공식 발표
 WikiFX
한국 경제, ‘반짝 성장’ 후 둔화… 원·달러 환율 어디로 갈까?
WikiFX제1회 WikiFX Korea 모의 투자 대회 시작! 벚꽃이 흩날리는 봄, WikiFX와 함께
WikiFX외환 투자에서 사기 브로커의 위험을 피하는 방법 | WikiFX, 규제 라이선스를 통해 리스크 식별 지원
WikiFX환율 계산기

