简体中文
繁體中文
English
Pусский
日本語
ภาษาไทย
Tiếng Việt
Bahasa Indonesia
Español
हिन्दी
Filippiiniläinen
Français
Deutsch
Português
Türkçe
한국어
العربية


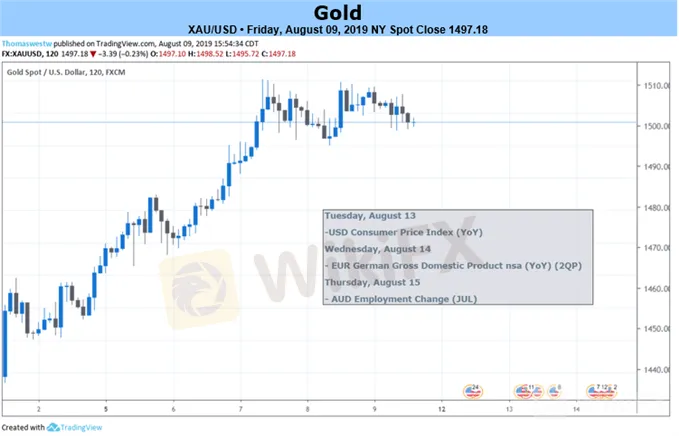
Gold Price Weekly Forecast: Bullish Breakout Remains In-Play
요약:Gold is currently consolidating just under $1,500/oz. after hitting a six-and-a-half year high of $1,511/oz. earlier this week. Positive fundamentals remain but markets dont move in a straight line.
Gold Price Fundamental Forecast:Neutral
Q3 2019 Gold Forecast and Top Trading Opportunities
Golds Price Correction May Offer Bulls a Better Trade
All bull markets have periods of price correction and consolidation and it looks as though gold is currently going through this process. While in the short-term it may not be the best trade to go long at current levels, in the longer-term golds price action suggests higher prices. However, it is even harder to suggest going short of gold at these levels with all fundamentals stacked against a sizeable move lower, leaving the sidelines the place to watch the market correction play out. All bull markets have periods of correction and consolidation, as loose holders get shaken out, and gold looks like it is currently following this pattern.
Check out our Technical Analysis section on the website for updated Gold chart levels and prices.
How to Trade Gold: Top Gold Trading Strategies and Tips
Gold Daily Chart (December 2018 - August 9, 2019)

The IG Client Sentiment Indicator shows retail traders are 60.6% net-long Gold, a bearish contrarian bias. However daily and weekly changes give us a stronger bearish Gold bias.
면책 성명:
본 기사의 견해는 저자의 개인적 견해일 뿐이며 본 플랫폼은 투자 권고를 하지 않습니다. 본 플랫폼은 기사 내 정보의 정확성, 완전성, 적시성을 보장하지 않으며, 개인의 기사 내 정보에 의한 손실에 대해 책임을 지지 않습니다.
WikiFX 브로커
최신 뉴스
WikiFX "3·15 외환 권리 보호의 날" – 블랙리스트 공식 발표
 WikiFX
제1회 WikiFX Korea 모의 투자 대회 시작! 벚꽃이 흩날리는 봄, WikiFX와 함께
WikiFX환율 계산기

