简体中文
繁體中文
English
Pусский
日本語
ภาษาไทย
Tiếng Việt
Bahasa Indonesia
Español
हिन्दी
Filippiiniläinen
Français
Deutsch
Português
Türkçe
한국어
العربية


US Dollar Price Outlook: DXY Threatens Larger Recovery– Trade Targets
요약:A rebound in the US Dollar has price testing a near-term resistance pivot and were looking for a reaction here. These are the levels that matter on the DXY charts.
US Dollar price recovery testing near-term resistance pivot- broader risk lower sub-98.40
Check out our 2019 projections in our Free DailyFX USD Trading Forecasts
Join Michael for Live Weekly Strategy Webinars on Mondays at 12:30GMT
The US Dollar Index turned just ahead of uptrend support last week with the recent rebound threatening larger recovery in price. These are the updated targets and invalidation levels that matter on the DXY charts heading into the close of the week. Review this week's Strategy Webinar for an in-depth breakdown of this oil price setup and more.
New to Forex Trading? Get started with this Free Beginners Guide
US Dollar Price Chart – DXY Daily
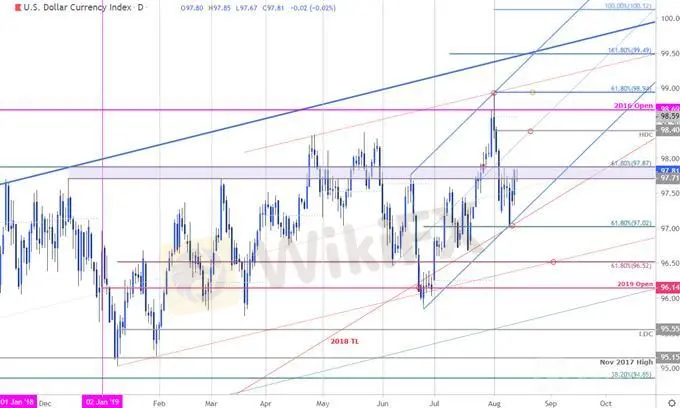
Chart Prepared by Michael Boutros, Technical Strategist; US Dollar Index on Tradingview
Technical Outlook: In my latest US Dollar Weekly Price Outlook we noted that, “DXY turned from big resistance last week and IF this pullback is the start of a larger correction, look for resistance ahead of 97.87.” Price turned just ahead of confluence support last week with the rebound now trading within the 97.71/87 resistance zone- look for a reaction here.
Why does the average trader lose? Avoid these Mistakes in your trading
US Dollar Price Chart – DXY 120min

Chart Prepared by Michael Boutros, Technical Strategist; US Dollar Index on Tradingview
Notes: A closer look at DXY price action shows the index trading within the confines of a broad ascending pitchfork formation extending off the June lows with the weekly opening-range now taking shape just below the confluence resistance at 97.87- a region defined by the 61.8% retracement of the 2017 decline and the 38.2% retracement of the August range.
A breach above this region would expose topside resistance objectives at 98.07/12 backed by the median-line / 61.8% retracement at 98.27- look for a reaction there IF reached. Ultimately a topside breach / close above the yearly high-day close at 98.40 would be needed to mark resumption of the broader up-trend. Support steady at the 97.21 with a break below 97.02 needed to suggest a more significant high was registered this month. Such a scenario would have us targeting initial support objectives at 96.52.
Learn how to Trade with Confidence in our Free Trading Guide
Bottom line: The US Dollar is testing near-term resistance here – IF broken, look for a larger recovery towards the median-line / uptrend resistance. From a trading standpoint, a good place to raise protective stops – ultimately, a larger recovery would have us looking for possible exhaustion / favorable short-entries on a stretch higher towards 98.27.
For a complete breakdown of Michaels trading strategy, review his Foundations of Technical Analysis series on Building a Trading Strategy
---
Relevant US Data Releases

Economic Calendar - latest economic developments and upcoming event risk.
Active Trade Setups
Gold Price Targets: XAU/USD at Critical Resistance – Trade Outlook
Euro Technical Price Outlook: EUR/USD Near-term Breakout Imminent
Aussie Price Outlook: Is the Australian Dollar Recovery Real?
Oil Price Outlook: Crude Spills into Support – WTI Trade Levels
Canadian Dollar Price Chart: USD/CAD Breakout Stalls at Six-Week High
면책 성명:
본 기사의 견해는 저자의 개인적 견해일 뿐이며 본 플랫폼은 투자 권고를 하지 않습니다. 본 플랫폼은 기사 내 정보의 정확성, 완전성, 적시성을 보장하지 않으며, 개인의 기사 내 정보에 의한 손실에 대해 책임을 지지 않습니다.
WikiFX 브로커
최신 뉴스
WikiFX "3·15 외환 권리 보호의 날" – 블랙리스트 공식 발표
 WikiFX
한국 경제, ‘반짝 성장’ 후 둔화… 원·달러 환율 어디로 갈까?
WikiFX제1회 WikiFX Korea 모의 투자 대회 시작! 벚꽃이 흩날리는 봄, WikiFX와 함께
WikiFX외환 투자에서 사기 브로커의 위험을 피하는 방법 | WikiFX, 규제 라이선스를 통해 리스크 식별 지원
WikiFX환율 계산기

