简体中文
繁體中文
English
Pусский
日本語
ภาษาไทย
Tiếng Việt
Bahasa Indonesia
Español
हिन्दी
Filippiiniläinen
Français
Deutsch
Português
Türkçe
한국어
العربية


Gold Price Looks Oversold, Silver Price Perched on Support

Абстракт:Gold in now trading in extreme oversold territory, according to one indicator, and may see a short-term pullback going into the long weekend.
Gold and Silver Price Analysis and Charts.
Gold chart remains negative but short-term oversold.
Silver propped up by the long-term moving average.
DailyFX Q2 Forecasts and Top 2019 Trading Opportunities.
Trading the Gold-Silver Ratio: Strategies and Tips.
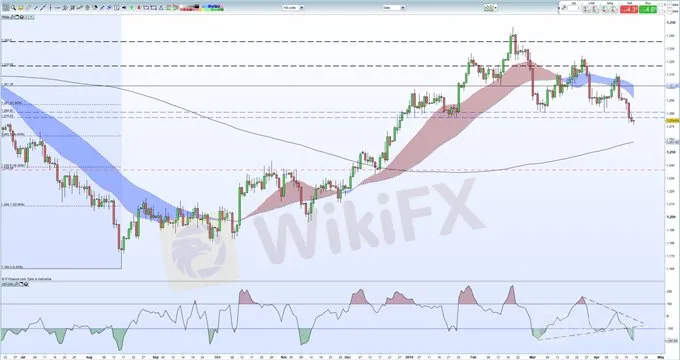
Gold – Chart Remains Oversold and Negative
The recent sell-off in gold has turned the medium-term outlook for the precious metal to negative with further losses likely ahead. To the downside, 50% Fibonacci retracement at $1,262.8/oz. guards the 200-day moving average around $,1258/oz. Gold also closed below the $1,276.8/oz. - $1,280.9/oz. zone which will likely change to resistance in the short-term. Gold bulls may find some hope from the CCI indicator at the bottom of the chart which is at its most oversold since mid-November and at an extreme level which may fuel a short-term uptick.
How to Trade Gold: Top Gold Trading Strategies and Tips.
Gold Daily Price Chart (June 2018 – April 18, 2019)
{9}
Silver – Chart Respecting the 200-Day Moving Average for Now
{9}
Silver remains propped up by the 200-day moving average for now, but any further re-tests of this level may see its price fall further. The long-term ma currently sits around $14.95 just ahead of the 23.6% Fibonacci retracement at $14.92. A close below all three moving-averages would change the chart bias to negative. The CCI indicator has just moved out of oversold conditions. To the upside, there are a cluster of recent highs and the 20- and 50-day moving averages between $15.10 and $15.35.
How to Trade Silver: Top Silver Trading Strategies.
Silver Daily Price Chart (July 2018 – April 18, 2019)

IG Client Sentiment shows how retail traders are positioned in a wide range of currencies, commodities and cryptocurrencies. See how recent changes in positioning affect our trading bias.
--- Written by Nick Cawley, Market Analyst
To contact Nick, email him at nicholas.cawley@ig.com
Follow Nick on Twitter @nickcawley1
Отказ от ответственности:
Мнения в этой статье отражают только личное мнение автора и не являются советом по инвестированию для этой платформы. Эта платформа не гарантирует точность, полноту и актуальность информации о статье, а также не несет ответственности за любые убытки, вызванные использованием или надежностью информации о статье.
WikiFX брокеры
FOREX.com
FP Markets
ATFX
Vantage
EC Markets
Pepperstone
FOREX.com
FP Markets
ATFX
Vantage
EC Markets
Pepperstone
WikiFX брокеры
FOREX.com
FP Markets
ATFX
Vantage
EC Markets
Pepperstone
FOREX.com
FP Markets
ATFX
Vantage
EC Markets
Pepperstone
Подсчет курса

