简体中文
繁體中文
English
Pусский
日本語
ภาษาไทย
Tiếng Việt
Bahasa Indonesia
Español
हिन्दी
Filippiiniläinen
Français
Deutsch
Português
Türkçe
한국어
العربية


Gold Price Sell-Off Continues, Silver Price Hits a Six-Month Low

Абстракт:Gold continues to fall and is now around $30 lower from last Tuesdays recent high, while Silver hit lows last seen in December last year.
Gold (XAU) and Silver (XAG) Price Analysis and Charts.
Gold (XAU) eyes a cluster of support.
Silver (XAG) makes afresh 2019 low as buyers disappear.
DailyFX Q2 Forecasts and Top 2019 Trading Opportunities.
Gold (XAU) Needs to Support to Hold
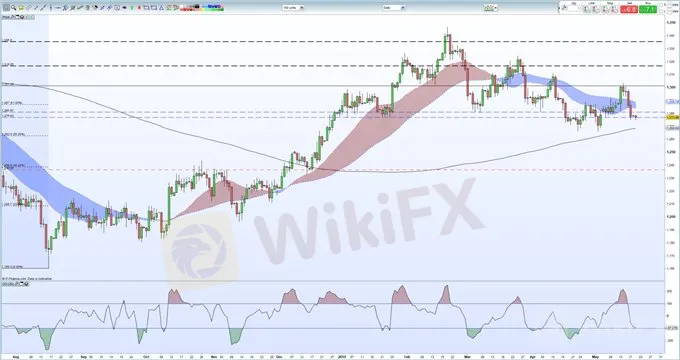
The sell-off on gold continues with the precious metal down around $30 in less than a week. Gold is under pressure from a resurgent US dollar, buoyed by last Fridays Uni of Michigan data which smashed expectations and hit a multi-year high. The important 61.8% Fibonacci retracement level at $1,287/oz. failed to provide any support when broken last week, while the $1,287 - $1,281/oz. zone made up of old horizontal support is being tested now. A clear break and close below opens the way to the recent double bottom around $1,266/oz. which is currently being guarded by the 200-day moving average at $1,268.6/oz. Below here the 50% Fibonacci retracement level at $1,262/oz heaves into view.
How to Trade Gold: Top Gold Trading Strategies and Tips
Gold (XAU) Daily Price Chart (August 2018 – May 20, 2019)
Silver (XAG) Nears a Fresh Six-Month Low
Another precious metal under heavy selling pressure. Silver is now at levels last seen in early December last year and is over 11% lower since making its recent high of $16.21/oz. in late February. The downtrend since the late-February high continues to be respected and it is possible that silver completely retraces all the way back down to the November 14 low at $13.89/oz. Psychological support at $14.00/oz. may slow the decline, while the CCI indicator shows that the market is extremely oversold.
Silver (XAG) Daily Price Chart (August 2018 - May 20, 2019)

Trading the Gold-Silver Ratio: Strategies and Tips.
IG Client Sentiment data show that retail traders are 79.1% net-long gold, a bearish contrarian indicator. Recent daily and weekly sentiment shifts give us a stronger bearish contrarian bias.
--- Written by Nick Cawley, Market Analyst
To contact Nick, email him at nicholas.cawley@ig.com
Follow Nick on Twitter @nickcawley1
Отказ от ответственности:
Мнения в этой статье отражают только личное мнение автора и не являются советом по инвестированию для этой платформы. Эта платформа не гарантирует точность, полноту и актуальность информации о статье, а также не несет ответственности за любые убытки, вызванные использованием или надежностью информации о статье.
WikiFX брокеры
Подсчет курса

