简体中文
繁體中文
English
Pусский
日本語
ภาษาไทย
Tiếng Việt
Bahasa Indonesia
Español
हिन्दी
Filippiiniläinen
Français
Deutsch
Português
Türkçe
한국어
العربية


Gold Price Eyes Bullish Consolidation, Silver Price Breaking Bear Sequence

Абстракт:Gold remains at lofty levels and needs a period of consolidation if it is to move higher. Silver's recent uptick is being constrained by the 200-day moving average.
Gold Price/Silver Price, Analysis and Charts.
Gold needs to fill the gap before the next leg higher, FOMC permitting.
Silver struggling with technical resistance.
DailyFX Q2 USD and Gold Forecasts and Top 2019 Trading Opportunities.
Gold Rejects 14-Month High
Gold‘s latest rally took it to within $3/oz. of levels last seen in April 2018 as the precious metal continued to rally on the back of a weakening US dollar. Gold has rallied nearly $70/oz. – 5.4% - in a week and the market is currently edging lower. The next move in the precious metal will be predicated by Friday’s US Labor report (NFPs) with any weakness in the jobs report a positive for the precious metal. Wednesdays US ADP employment change report rattled the US dollar, missing expectations by a wide margin – actual 27k vs 183k exp – and printing a nine-year low.
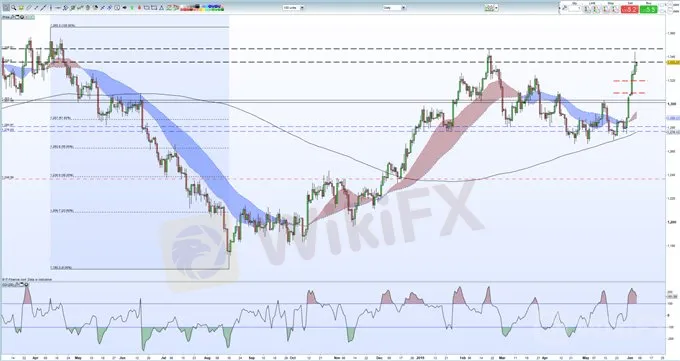
On the charts, gold may well look to fill the gap between $1,309/oz, and $1,320/oz. before any attempt to move higher. Below here there is a tight zone between $1,301 and $1,304/oz. that has provided supportive. To the upside, $1,346.8/oz. guards April 2018 high at $1,365/oz. a level that may well be tested if US NFPs miss expectations.
The CCI indicator shows that the market remains heavily overbought and may well slow any further upside in the short-term.
DailyFX Economic Calendar
How to Trade Gold: Top Gold Trading Strategies and Tips
Gold (XAU) Daily Price Chart (March 2018 – June 6, 2019)
IG Client Sentimentshows that retail traders are 59.4% net-long gold, a bearish contrarian indicator. Recent daily and weekly sentiment shifts however give us a stronger bearish contrarian trading bias.
Silver Runs into Resistance
Silver traded above $15 yesterday but ran into heavy resistance from the 200-day moving average that has help sway since the start of May. Wednesdays trading range was re-traced, and silver now trades around $14.89, below the 23.6% Fibonacci retracement level at $14.92 and the 200-day moving average at $15.02. The chart is flashing an overbought signal, but the recent series of lower highs has been broken, adding a positive longer-term spin. It may take a little longer for the chart s to confirm, or not, that silver is out of a bear market.
Silver Daily Price Chart (July 2018 – June 6, 2019)

Отказ от ответственности:
Мнения в этой статье отражают только личное мнение автора и не являются советом по инвестированию для этой платформы. Эта платформа не гарантирует точность, полноту и актуальность информации о статье, а также не несет ответственности за любые убытки, вызванные использованием или надежностью информации о статье.
WikiFX брокеры
WikiFX брокеры
Подсчет курса

