简体中文
繁體中文
English
Pусский
日本語
ภาษาไทย
Tiếng Việt
Bahasa Indonesia
Español
हिन्दी
Filippiiniläinen
Français
Deutsch
Português
Türkçe
한국어
العربية


Gold Price Targets: XAU/USD Breakout Halted at Trend Resistance

Абстракт:Gold prices ripped into multi-year trend resistance this week - the breakout is vulnerable while below. Here are the levels that matter on the XAU/USD weekly chart.
Gold price breakout testing multi-year uptrend resistance– rally vulnerable below 1526
Join Michael for Live Weekly Strategy Webinars on Mondays at 12:30GMT
Gold prices are poised to rally for a third consecutive week and would mark the eleventh advance in the past thirteen weeks. The price breakout ran into a critical resistance zone weve been tracking for months now and leaves the broader long-bias vulnerable while below up-trend resistance. These are the updated targets and invalidation levels that matter on the XAU/USD weekly price chart. Review my latestWeekly Strategy Webinar for an in-depth breakdown of this gold price setup and more.
Gold Price Chart - XAU/USD Weekly
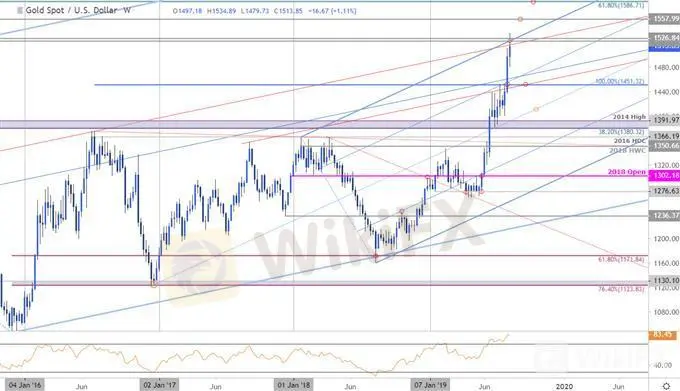
Chart Prepared by Michael Boutros, Technical Strategist; Gold on Tradingview
Notes: In my last XAU/USD PriceOutlook we noted that gold was, “testing a critical resistance confluence at 1522/26 and were looking for a reaction up here.” Price briefly registered a high at 1534 before reversing sharply with the focus now on a weekly close in relation to this key threshold. Note that weekly RSI now has momentum at the highest reading since the record 2011 high.
Weekly support remains with the 50% retracement of the decline off the record highs at 1483 backed by key support / medium-term bullish invalidation at 1451. A topside breach exposes subsequent weekly resistance objectives at 1558 and the 61.8% retracement at 1586- look for a bigger reaction there IF reached.
Bottom line: The gold breakout is testing major confluence resistance up here - watch the weekly close. The risk for a near-term pullback / correction mounts if we settle below 1526. From a trading standpoint, a good place to reduce long-exposure / raise protective stops – be on the lookout for possible exhaustion. Ultimately a larger pullback may offer more favorable entries closer to slope support. Review my latest Gold Price Outlook for a closer look at the near-term XAU/USD technical trading levels.
Even the most seasoned traders need a reminder every now and then-Avoid these Mistakes in your trading
Gold Trader Sentiment (XAU/USD)

A summary of IG Client Sentiment shows traders are net-long Gold - the ratio stands at +1.69 (62.9% of traders are long) – bearish reading
Long positions are 3.1% higher than yesterday and 9.6% higher from last week
Short positions are 1.4% higher than yesterday and 8.1% lower from last week
We typically take a contrarian view to crowd sentiment, and the fact traders are net-long suggests Spot Gold prices may continue to fall. Traders are further net-long than yesterday & last week, and the combination of current positioning and recent changes gives us a stronger Spot Gold-bearish contrarian trading bias from a sentiment standpoint.
Отказ от ответственности:
Мнения в этой статье отражают только личное мнение автора и не являются советом по инвестированию для этой платформы. Эта платформа не гарантирует точность, полноту и актуальность информации о статье, а также не несет ответственности за любые убытки, вызванные использованием или надежностью информации о статье.
WikiFX брокеры
Подсчет курса

