简体中文
繁體中文
English
Pусский
日本語
ภาษาไทย
Tiếng Việt
Bahasa Indonesia
Español
हिन्दी
Filippiiniläinen
Français
Deutsch
Português
Türkçe
한국어
العربية


Canadian Dollar Price Chart: Loonie Rips as USD/CAD Tests Resistance
บทคัดย่อ:The Canadian Dollar is up nearly 0.5% against the US Dollar after reversing off a key technical confluence zone. Here are the levels that matter on the USD/CAD weekly chart.
USD/CAD threatens outside-weekly reversal off technical resistance- risk below monthly open.
Check out our 2019 projections in our Free DailyFX USD Trading Forecasts
Join Michael for Live Weekly Strategy Webinars on Mondays at 12:30GMT
The Canadian Dollar is up nearly 0.5% against the US Dollar after reversing off a key technical confluence zone. The turn off eleven-week highs threatens a larger decline in price while below the objective monthly open. Here These are the updated targets and invalidation levels that matter on the USD/CAD weekly price chart. Review my latest Weekly Strategy Webinar for an in-depth breakdown of this Aussie price setup and more.
USD/CAD Price Chart – Loonie Weekly
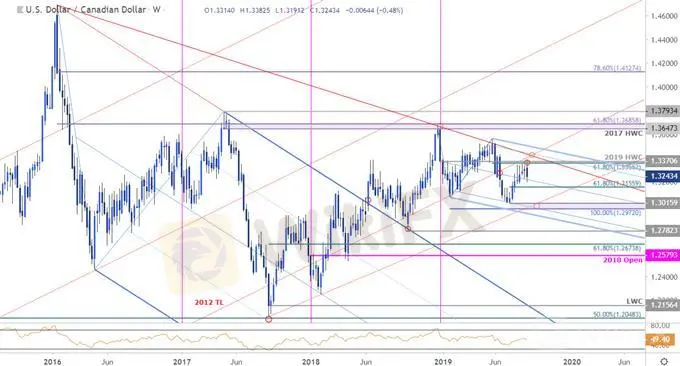
Chart Prepared by Michael Boutros, Technical Strategist; USD/CAD on Tradingview
Notes: In last months Canadian Dollar Weekly Outlook in we noted that a four week advance in USD/CAD was targeting critical resistance, “at the 61.8% retracementof the May decline / 2019 high-week close at 1.3355/70...” Price marked a seven-week advance before finally registering a high this week at 1.3382 with USD/CAD now poised to mark an outside weekly-reversal if we close at these levels.
The decline tested support on Thursday at the median-line of the descending pitchfork formation weve been tracking off the 2018/2019 highs. A break / close below this trendline is needed to suggest a more significant high is in place targeting the 61.8% retracement of the July advance at 1.3156- look for a bigger reaction there IF reached with weakness beyond this point threatening a drop towards key confluence support at 1.2972-1.3015 where the yearly lows and the 100% extension converges on the 2017/2018 trendline. A topside breach above 1.3355/70 would still have to deal with the highlighted resistance confluence near 1.3430s.
For a complete breakdown of Michaels trading strategy, review his Foundations of Technical Analysis series on Building a Trading Strategy
Bottom line: USD/CAD turned from a technically significant resistance zone this week with the reversal of a near two-month long rally risking further losses for the Dollar. From a trading standpoint, expect sideways to lower from here- look for resistance ahead of the September open at 1.3314 IF price has indeed turned the corner here. Ill publish an updated USD/CAD Trade Outlook once we get further clarity in near-term price action.
USD/CAD Sentiment – Loonie Price Chart

A summary of IG Client Sentiment shows traders are net-short USD/CAD- the ratio stands at -1.3 (43.5% of traders are long) – weak bullishreading
Traders have remained net-short since July 23rd; price has moved 1.2% higher since then
Long positions are32.8% higher than yesterday and 41.0% higher from last week
Short positions are 12.5% lower than yesterday and 36.3% lower from last week
We typically take a contrarian view to crowd sentiment, and the fact traders are net-short suggests USD/CAD prices may continue to rise. Yet traders are less net-short than yesterday and compared with last week. Recent changes in sentiment warn that the current USD/CAD price trend may soon reverse lower despite the fact traders remain net-short.
ข้อจำกัดความรับผิดชอบ:
มุมมองในบทความนี้แสดงถึงมุมมองส่วนตัวของผู้เขียนเท่านั้นและไม่ถือเป็นคำแนะนำในการลงทุน สำหรับแพลตฟอร์มนี้ไม่รับประกันความถูกต้องครบถ้วนและทันเวลาของข้อมูลบทความ และไม่รับผิดชอบต่อการสูญเสียใด ๆ ที่เกิดจากการใช้ข้อมูลในบทความ
WikiFX โบรกเกอร์
FBS
HFM
OANDA
EC Markets
ATFX
Vantage
FBS
HFM
OANDA
EC Markets
ATFX
Vantage
WikiFX โบรกเกอร์
FBS
HFM
OANDA
EC Markets
ATFX
Vantage
FBS
HFM
OANDA
EC Markets
ATFX
Vantage
ข่าวล่าสุด
เตือนภัย! กลโกงใหม่ใช้ SMS แจ้งค่าปรับจอดรถ อย่ากดคลิกเด็ดขาด
 WikiFX
ทองปิดบวก 5 ดอลลาร์ ตลาดจับตาประชุมเฟด
WikiFX5 อันดับโบรกเกอร์ ยอดนิยมในประเทศไทย ประจำเดือนกุมภาพันธ์
WikiFXSkyLine Spotlight: XM เป็นผู้นำแห่งอนาคตด้วยความเป็นเลิศ
WikiFXเหตุการณ์สำคัญทางเศรษฐกิจที่น่าสนใจสัปดาห์นี้
WikiFXความเสี่ยงในการลงทุนในคริปโต
WikiFXเผยแนวการลงทุน วิธีเลือกหุ้นของ "วอร์เรน บัฟเฟตต์"
WikiFXราคาน้ำมันพุ่งขึ้นจากความตึงเครียดในทะเลแดงและแผนกระตุ้นการบริโภคของจีน
WikiFXเงินบาทแข็งค่าเท่าช่วงก่อนต้มยำกุ้งแล้ว น่ากังวลแค่ไหน?
WikiFXคำนวณอัตราแลกเปลี่ยน

