简体中文
繁體中文
English
Pусский
日本語
ภาษาไทย
Tiếng Việt
Bahasa Indonesia
Español
हिन्दी
Filippiiniläinen
Français
Deutsch
Português
Türkçe
한국어
العربية
Platinum Price Forecast: Auctioning inside a bearish flag, bears are hopeful to visit $1,040
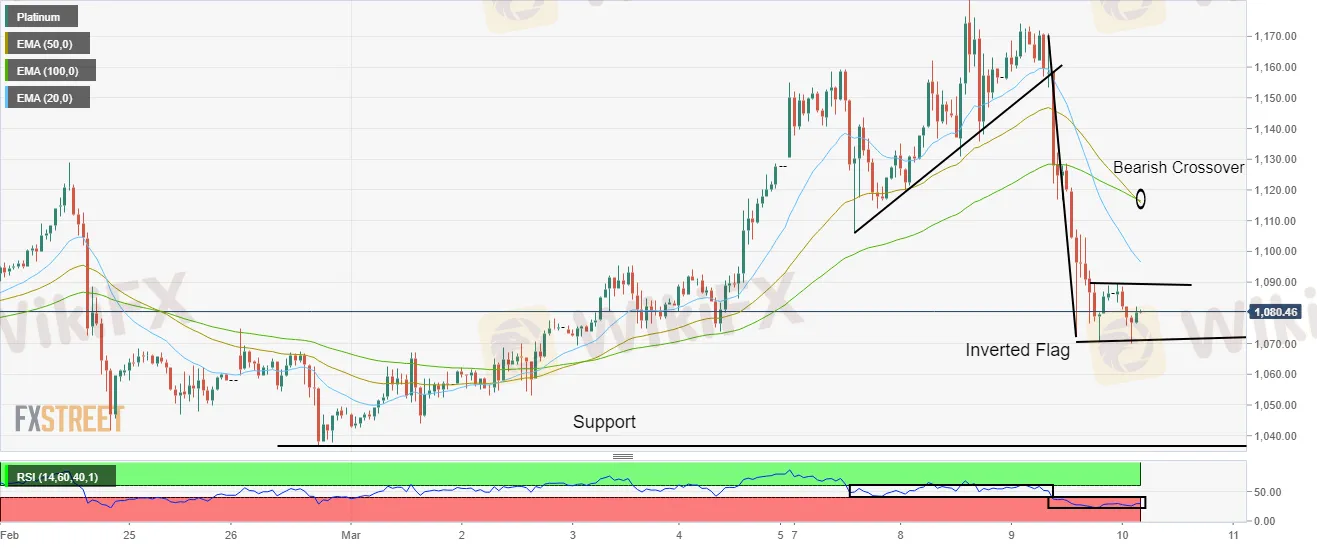
Abstract:Platinum (XPT/USD) is oscillating in a range of $1,070.04-1,089.85 in the Tokyo session. The bullion has witnessed a firmer plunge after violating the trendline placed from the March 7 low of $1105.90, adjoining the March 8 low at $1,119.76. After skidding below the trendline placed, Platinum has found the ground near $1,070.

Platinum is auctioning inside an inverted flag formation.
Bears are firmer on a bearish crossover of the 50-period and 100-period EMAs.
Oscillation of the RSI (14) in a 20.00-40.00 range validates a bearish setup.
On an hourly scale, Platinum price is forming an inverted flag pattern, which signals a directionless move after a steep fall and leads to a further downside if consolidation breaks lower decisively.
Generally, a consolidation phase denotes the placement of offers by the market participants who didnt capitalize upon the initial rally or those investors place bids, which prefer to enter in an auction once the bearish stage sets in.
The 20-period Exponential Moving Average (EMA) at $1,096.55 will act as a major resistance for the asset going forward.
The 50-period and 100-period EMAs have given a fresh bearish crossover at $1,116.73, which adds to the downside filters.
The Relative Strength Index (RSI) (14) has shifted its trading range from 40.00-60.00 to 20.00-40.00, which validates a bearish setup.
For more downside, Platinum needs to skid below Thursdays low at $1,070.04, which will drag it lower to March 2 low at $1,053.04. Breach of the latter will send the pair towards February 28 low at $1,036.35.
On the flip side, bulls can take the driving seat if the Platinum violates March 4 high at $1,094.13. This will bring some significant bids and the Platinum price can shift higher near March 7 low of $1105.90, followed by a 50-period EMA at $1,116.73.
Platinum hourly chart

Disclaimer:
The views in this article only represent the author's personal views, and do not constitute investment advice on this platform. This platform does not guarantee the accuracy, completeness and timeliness of the information in the article, and will not be liable for any loss caused by the use of or reliance on the information in the article.
Read more

The president of @Liberland, @Vít Jedlička come on stage, dialogue on trading security.
The 2025 WikiEXPO Hong Kong Station is about to grandly open. the president of @Liberland, @Vít Jedlička come on stage, dialogue on trading security.

Countdown: 1 day.WikiEXPO2025's first stop, Hong Kong, is about to open.
⏰ Countdown: 1 day. WikiEXPO2025's first stop, Hong Kong, is just tomorrow. Focus on transaction security and explore new investment opportunities. ???? Get ready to start now. See you tomorrow.

JustForex vs JustMarkets: A Comprehensive Comparison in 2025
Selecting the right forex broker can make the difference between trading success and frustration for most investors, especially retail investors. As retail traders gain unprecedented access to global markets, the choice between platforms like JustForex and JustMarkets becomes increasingly significant. Both brokers offer some shining features within the forex and CFD trading space, but their approaches differ in some areas.
Vault Markets Review 2025: Live & Demo Accounts, Withdrawal to Explore
Vault Markets, a South African-based broker, has attracted much attention in recent days, particularly within its region. This online broker only offers access to focused trading opportunities on Indices, Currencies, Energies, and Metals, yet it shines on low minimum deposits plus various bonus programmes, which would encourage more investors, especially beginners, to trade with a small budget. However, Vault Markets operates outside of the authorized scope, so we don't consider it solid to trade with.
WikiFX Broker
Latest News
How Crypto Trading Transforms FX and CFD Brokerage Industry
UK would not hesitate to retaliate against US tariffs - No 10 sources
FCA Warns Against 10 Unlicensed or Clone Firms
CySEC Warns Against 14 Unlicensed Investment Websites
Top Currency Pairs to Watch for Profit This Week - March 31, 2025
Will natural disasters have an impact on the forex market?
Philippines Deports 29 Indonesians Linked to Online Scam Syndicate in Manila
Navigating the Intersection of Forex Markets, AI Technology, and Fintech
Exposed: Deceptive World of Fake Trading Gurus – Don’t Get Fooled!
AI-Powered Strategies to Improve Profits in Forex Trading
Currency Calculator


