简体中文
繁體中文
English
Pусский
日本語
ภาษาไทย
Tiếng Việt
Bahasa Indonesia
Español
हिन्दी
Filippiiniläinen
Français
Deutsch
Português
Türkçe
한국어
العربية
How to Trade Forex using Exponential Moving Averages
Abstract:To begin, let us debunk a myth that gets circulated amongst new traders. Many believe that there is some type of “magical moving average” that the banks follow. They believe that somewhere there is a moving average that “cannot miss.” Nothing could be further from the truth, as much like anything else, a moving average is simply a tool which traders can use to define a trend, and perhaps find potential areas of support and resistance. The key word here of course is “potential.”

To begin, let us debunk a myth that gets circulated amongst new traders. Many believe that there is some type of “magical moving average” that the banks follow. They believe that somewhere there is a moving average that “cannot miss.” Nothing could be further from the truth, as much like anything else, a moving average is simply a tool which traders can use to define a trend, and perhaps find potential areas of support and resistance. The key word here of course is “potential.”
What is an “EMA” in Forex Trading?
“EMA” stands for Exponential Moving Average. To understand what it actually is, you need to understand what a simple moving average is. The moving average is a plotting of the average price over the last defined number of candlesticks. In other words, it is the average price over the previous 20 candles, 50 candles, 100 candles, or whatever. The trader can select how many candles they want to look back at. While moving averages can use the open, high, low, or close price of the candlestick, 99.9% of the time you will see people use them applied to the closing prices of these candlesticks.
Simple moving average (SMA) is the most basic moving average computation. To put it another way, if you plot the 20 SMA on a chart, it will tell you what the average price was at the closure of the preceding 20 candlesticks. As the market moves on to the next candlestick, the computation will simply be adjusted to include only the 20 candlesticks that came before it, and so on. The SMA's estimated value is obtained by adding the average closing prices and dividing by 20. The computation is then plotted on the chart, with a line drawn across all of the dots to produce a larger line that spans the chart's width.
The EMA is the same thing in Forex trading, however the formula is mathematically weighted to give the most recent candlesticks greater weight. This makes this sort of moving average more sensitive to price movements and, as a result, more likely to shift direction. In Forex trading, which form of moving average should you use? The EMA is utilized by the majority of traders, however they are typically employed in the same way.
In Forex Trading, the EMA is Typically Used
In Forex online trading, the EMA may be used in a variety of ways, and the only restriction is your imagination.
The Exponential Moving Average (EMA) is a trend-following indicator.
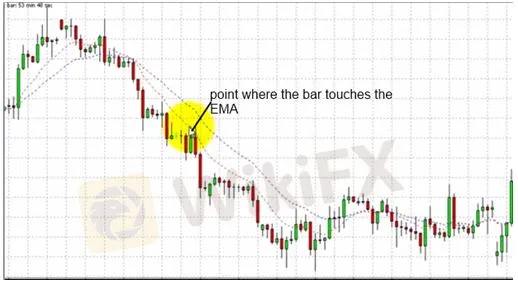
However, traders commonly employ the EMA as a trend indicator in its most basic form. To put it another way, if the moving average is rising over time, the trend is likely to be quite favorable as well. When a moving average falls over time, the market is considered bearish or negative.
Dynamic Support/Resistance using EMA
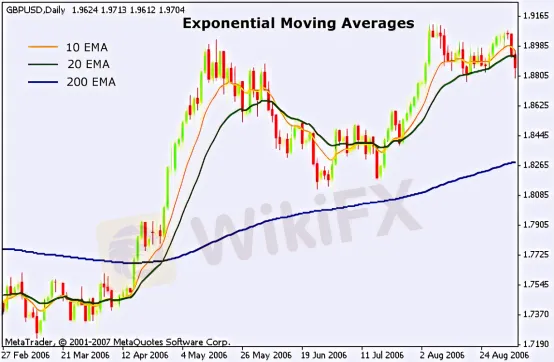
Specific EMAs are used by some traders as dynamic support and resistance. This is due to the fact that certain Exponential Moving Averages are quite popular. The majority of them are reminiscent of the days of stock trading. The 20-day EMA, 50-day EMA, 100-day EMA, and 200-day EMA are some of the most popular. This psychological habit of utilizing these specific round numbers dates back to the early days of technical analysis, therefore it is more or less a convention than anything more.
As your internet trading career progresses, you will come across moving averages that individuals claim perform better than others, but it is ultimately a matter of personal opinion. Short-term traders prefer lower numbers, such as the 9 EMA, since they react more faster than larger numbers, such as the 50 EMA. If you are a longer-term trend trader, however, you will pay far more attention to larger numbers because it takes much more information and movement to shift the direction of those moving averages, allowing you to stay in the trade for much longer.

As a “Dragon,” many EMAs
There are numerous EMAs plotted in the price chart below, and you can see how each one reacts to price differently on the daily chart. The 9, 20, 50, 100, and 200-day EMAs are depicted on this chart. In fact, some people employ this precise setup to ensure that they are trading with a large number of traders when it comes to the trend. They will only trade in the same direction as all moving averages when they are all moving in the same direction.
Crossover System for EMA
Another method that investors would utilize the EMA as an indicator is in a trading technique known as a “crossover system.” This is one of the most fundamental online trading methods available, and it requires a trend to be lucrative. This is accomplished by combining two moving averages, one for short-term use and the other for longer-term use. The 50-day EMA is represented in red, and the 200-day EMA is plotted in black in the price chart of the CAD/JPY currency cross shown below.
The concept is that you should aim to place long trades whenever the shorter moving average, in this example the 50-day EMA, rises above the 200-day EMA. If the 50-day EMA crosses below the 200-day EMA, on the other hand, you should consider taking short transactions. When the crossing occurs, some traders utilize this as a mechanical method to produce trades with no filter. The major issue with this is that it requires a strong trend to function, and in a range market, you'll see a lot of whipsaw trading, resulting in a lot of little losses, but ultimately you'll find a strong trend and make significant gains. To be able to trade something, you need a specific sort of mindset.
Last Thoughts
The Exponential Moving Average is one of the most fundamental and often used technical indicators. It is not, however, a “silver bullet” for profit. It's just a tool like any other indicator, and you should be wary of anyone who claims that “this is the moving average the banks use,” because there's no such thing as a magic formula. Moving averages can help you figure out which way the trend is going and where certain traders could be looking to buy or sell, but you should still utilize price action to make your trading decisions, since all indications are secondary to the overall picture. They're used to confirm price activity rather than to replace it. The price chart below shows an example of a breakthrough that is validated by the 20 EMA.

Disclaimer:
The views in this article only represent the author's personal views, and do not constitute investment advice on this platform. This platform does not guarantee the accuracy, completeness and timeliness of the information in the article, and will not be liable for any loss caused by the use of or reliance on the information in the article.
Read more

WikiFX Review: Is IVY Markets Reliable?
IVY Markets, established in 2018, positions itself as a global brokerage offering a diverse range of trading instruments, including Forex, Commodities, Cryptocurrencies, and Stocks. The platform provides two primary account types—Standard and PRO—with a minimum deposit requirement of $50 and leverage up to 1:400.

Germany's Election: Immigration, Economy & Political Tensions Take Centre Stage
Germany is set to hold a crucial general election on 23 February 2025, with voter frustration over migration emerging as a dominant issue.

XTB Secures Chilean License, Expands Latin America Footprint
XTB gains a securities agent license in Chile, boosting its Latin America presence. The broker plans to offer stocks, ETFs, and derivatives to local investors.

Deepfake Deception: New Face of Financial Scams in Forex and Crypto
In the ever-evolving landscape of financial scams, fraudsters are now leveraging cutting-edge artificial intelligence (AI) to deceive unsuspecting victims. Deepfake technology, which manipulates audio and video to create hyper-realistic but entirely fabricated content, has become a powerful tool for scammers, particularly in the forex and cryptocurrency markets.
WikiFX Broker
Latest News
Germany's Election: Immigration, Economy & Political Tensions Take Centre Stage
WikiFX Review: Is IVY Markets Reliable?
IG 2025 Most Comprehensive Review
Top Profitable Forex Trading Strategies for New Traders
EXNESS 2025 Most Comprehensive Review
New SEC Chair Paul Atkins Targets Crypto Regulation Reform
ED Exposed US Warned Crypto Scam ”Bit Connect”
Currency Calculator


