简体中文
繁體中文
English
Pусский
日本語
ภาษาไทย
Tiếng Việt
Bahasa Indonesia
Español
हिन्दी
Filippiiniläinen
Français
Deutsch
Português
Türkçe
한국어
العربية
Bitcoin Saw Key Technical Breakout: Big Reaction From Bulls Imminent
Abstract:BTC is showing positive signs and might rally towards the $50,000 resistance zone.
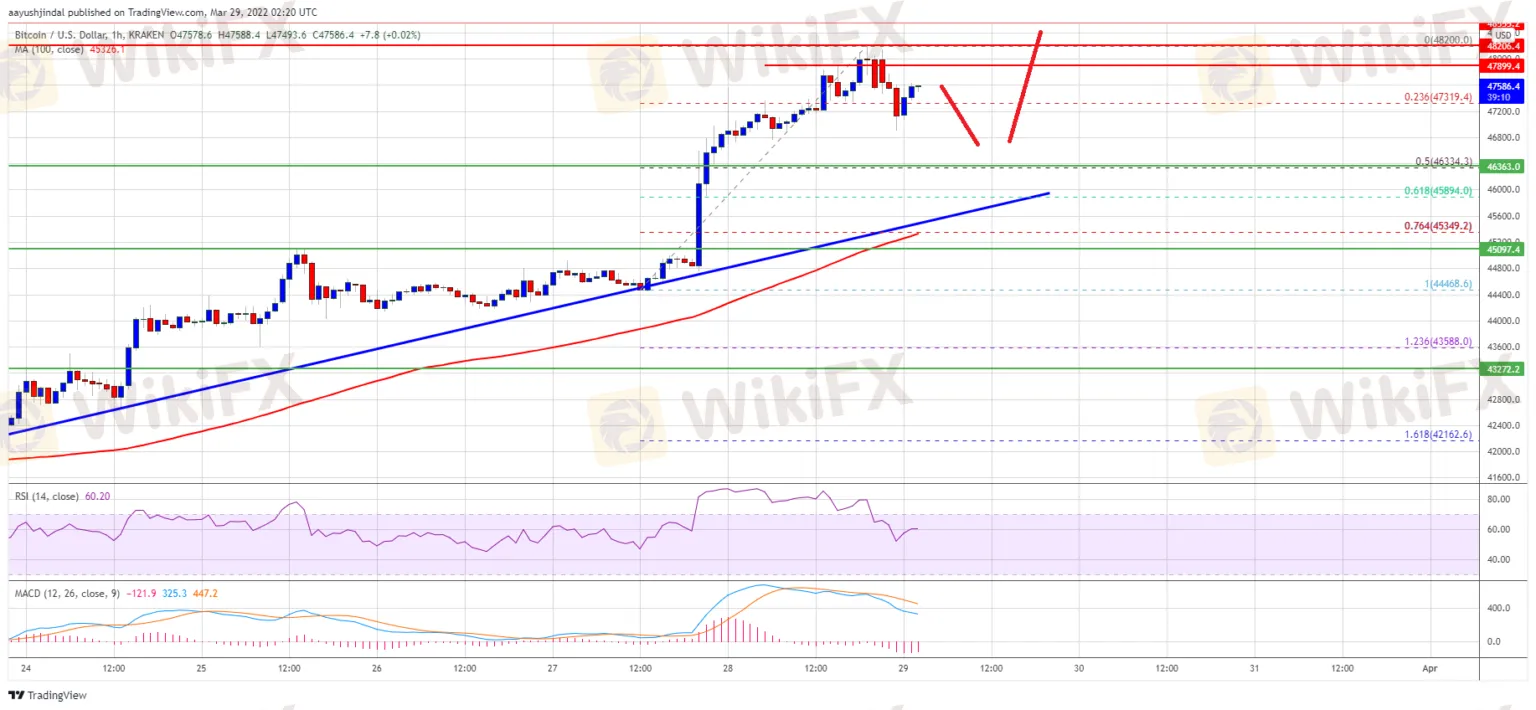
Bitcoin gained pace above the $47,000 resistance against the US Dollar. BTC is showing positive signs and might rally towards the $50,000 resistance zone.
Bitcoin saw a major technical breakout above the $45,500 resistance zone.
The price is trading above $46,500 and the 100 hourly simple moving average.
There is a crucial bullish trend line forming with support near $46,200 on the hourly chart of the BTC/USD pair (data feed from Kraken).
The pair could continue to rise and might trade towards the $50,000 resistance zone.
Bitcoin Price Breaks $48K
Bitcoin price remained strong above the $45,500 resistance zone. BTC started a fresh increase and was able to clear the $46,500 resistance zone.
The upward move gained pace above the $46,500 level and the price settled above the 100 hourly simple moving average. Finally, it spiked above the $48,000 level. A high was formed near $48,200 and the price is now consolidating gains.
There was a minor drop below the $48,000 level. Bitcoin traded below the 23.6% Fib retracement level of the upward move from the $44,470 swing low $48,200 high. Besides, there is a crucial bullish trend line forming with support near $46,200 on the hourly chart of the BTC/USD pair.
On the upside, the price is facing resistance near the $48,000 level. The next major resistance could be near the $48,200 zone. A successful break and close above the $48,200 level might push the price towards $49,000.

he next major resistance could be near the $49,500 level. Any more gains could open the doors for a move towards the $50,000 level.
Dips Limited in BTC?
If bitcoin fails to clear the $48,200 resistance zone, it could start a downside correction. An immediate support on the downside is near the $47,000 zone.
The next major support is seen near the $46,350 level. It is near the 50% Fib retracement level of the upward move from the $44,470 swing low $48,200 high. The main support is near the $46,000 level and the trend line. A downside break below the $46,000 support zone could send the price to $45,000.
Technical indicators:
Hourly MACD – The MACD is slowly gaining pace in the bearish zone.
Hourly RSI (Relative Strength Index) – The RSI for BTC/USD is now above the 50 level.
Major Support Levels – $47,000, followed by $46,000.
Major Resistance Levels – $48,200, $49,000 and $50,000.
Disclaimer:
The views in this article only represent the author's personal views, and do not constitute investment advice on this platform. This platform does not guarantee the accuracy, completeness and timeliness of the information in the article, and will not be liable for any loss caused by the use of or reliance on the information in the article.
Read more

Twin Scam Alert: Broker Capitals is a New Domain of Finex Stock
This week, the Italy financial regulator CONSOB issued a warning against an unlicensed broker named Broker Capitals. When we clicked on Broker Capitals' website, its logo, trade name, and design seemed familiar to us.

Berkshire CEO-designate Abel sells stake in energy company he led for $870 million
Berkshire Hathaway Inc said on Saturday that Vice Chairman Greg Abel, who is next in line to succeed billionaire Warren Buffett as chief executive, sold his 1% stake in the company’s Berkshire Hathaway Energy unit for $870 million.

Paying particular heed to payrolls
A look at the day ahead in markets from Alun John

Dollar extends gains against yen as big Fed hike bets ramp up
The dollar extended it best rally against the yen since mid-June on Monday, buoyed by higher Treasury yields after blockbuster U.S. jobs data lifted expectations for more aggressive Federal Reserve policy tightening.
WikiFX Broker
Latest News
SquaredFinancial offers Trump & Melania meme coins
What is the Best Time to Trade Forex?
Win Rewards & Celebrate Lunar NY with JustMarkets
BBC World Service to axe 130 jobs in bid to save £6m
AI Fraud Awareness Campaign: "We're Not All F**ked"
Crypto.com Delists USDT and 9 Tokens to Comply with MiCA Regulations
How to Use Financial News for Forex Trading?
Fake ‘cyber fraud online complaint’ website Exposed!
Day Trading Guide: Key Considerations
GMO-Z com Securities Thailand to Cease Operations in 2025
Currency Calculator


