简体中文
繁體中文
English
Pусский
日本語
ภาษาไทย
Tiếng Việt
Bahasa Indonesia
Español
हिन्दी
Filippiiniläinen
Français
Deutsch
Português
Türkçe
한국어
العربية
WTI Price Analysis: Bulls are firmer on descending channel breakout, $116.00 eyed
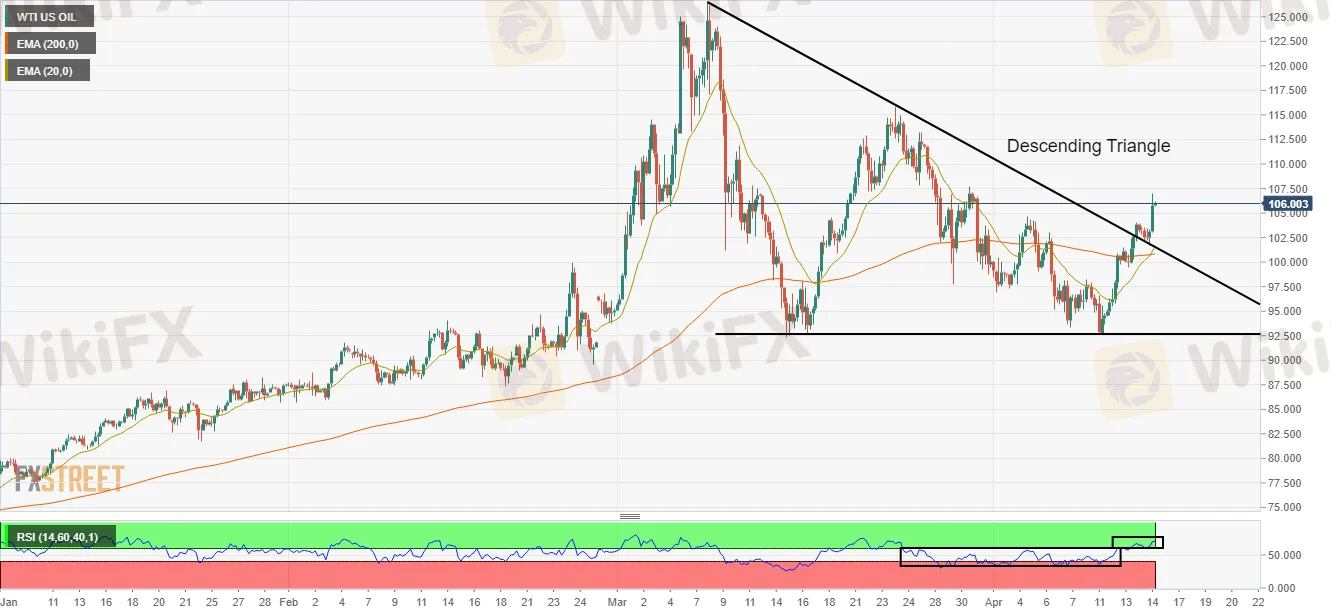
Abstract:West Texas Intermediate (WTI), futures on NYMEX, have displayed a strong upside move after printing monthly lows of $92.79 on Monday. The black gold has defended its critical bottom of $92.37 printed on March 15. The asset has delivered a three-day winning streak and is likely to extend gains after overstepping Thursdays high at $107.00.

A firmer breakout of the descending triangle pattern has underpinned the bulls.
The RSI (14) has shifted into a bullish range that adds to the upside filters.
A minor pullback towards $104.02 will present an optimal buying opportunity for the asset.
On a four-hour scale, a breakout of a descending triangle has put the bulls in the driving seat. Usually, a descending triangle breakout is followed by wider ticks and high volumes. The horizontal support of the chart pattern is plotted from March lows at $92.37 while the descending trendline is placed from March high at $126.51, adjoining the March 24 high at $115.87.
A bull cross, represented by 20- and 200-period Exponential Moving Averages (EMAs), is advocating the control of bulls on the asset.
Meanwhile, the Relative Strength Index (RSI) (14) has shifted into a bullish range of 60.00-80.00 from 40.00-60.00, which are hinting at a fresh impulsive wave ahead.
A minor pullback towards Wednesdays high at $104.02 will be an optimal opportunity for the buyers, which will send the asset towards the March 28 high at $109.78, followed by March 24 high to near $116.00.
On the flip side, bears may dictate the prices if the asset drop below the 20-EMA at $100.80. This will drag the asset towards the round level support and horizontal support at $95.00 and $92.37 respectively.
WTI four-hour chart

Disclaimer:
The views in this article only represent the author's personal views, and do not constitute investment advice on this platform. This platform does not guarantee the accuracy, completeness and timeliness of the information in the article, and will not be liable for any loss caused by the use of or reliance on the information in the article.
Read more
Libertex Review 2025: Live & Demo Accounts, Withdrawal to Explore
Founded in 2012, Libertex is a Cyprus-based online broker providing both investment and trading services. They offer access to over 350 instruments, including CFDs and real stocks. Libertex has become a popular choice among retail investors, largely due to its competitive trading costs, robust trading platform, a 100% welcome bonus for new clients (subject to certain deposit requirements and trading activity), and the availability of fractional shares. However, notably, Libertex does not currently offer copy trading functionality and its educational resources are somewhat limited.
JustMarkets Review 2025: Live & Demo Accounts, Withdrawal to Explore
Established in 2012, JustMarkets (Formerly JustForex) is an online forex broker based in Cyprus and serves clients in over 160 countries. Featuring a low entry barrier, a 50% deposit bonus, and robust trading platforms -MT4 and MT5, JustMarkets has gained great popularity among retail investors in recent years. JustMarkets allows traders to trade over 260 CFD-based instruments, which is not an extensive range, yet on leverage up to 3000:1 to increase trading flexibility. To enhance the trading experience, both MT4 and MT5 are provided, along with JustMarkets Trading App, MetaTrader Mobile App, and MetaTrader WebTerminal. JustMarkets offers a 50% deposit bonus to boost traders' confidence. Opening an account is a fully online process, typically completed within one day.

CM Trading Review 2025: Accounts, Demo Account and Withdrawal to Explore
CM Trading is a South Africa-based online broker operating for 10 years, providing trading on Forex, Commodities, Indices, Stocks, and some Cryptos. Among many forex broker options in South Africa, CM Trading struggles to be the popular one due to its high costs for live accounts and wide spreads. Instead, it is considered an expensive broking. To open a live account, traders need to fund at least $299, less friendly to beginners. However, CM Trading compensates for this by offering large amounts of bonuses up to $150,000. Notably, CM Trading does not provide any popular copy trading solutions.

FBS Review 2025: Accounts, Withdrawals & Trading Platforms to Explore
FBS, more of an A-Book broking company, offers trading services through its three entities in Belize, Australia, and Europe, respectively. With the FBS platform, traders can get access to over 550 CFD-based instruments, including Forex, Indices, Energy, Stocks and Cryptocurrency through the FBS App and MetaTrader suite—MetaTrader 4 and MetaTrader 5. FBS's shining features, an extremely low entry barrier from $5 and its generous leverage up to 3000:1, attract active traders the most. competitor However, FBS does not provide tiered account options, only one live account offered for all investors, but opening an account here is quick and easy. FBS's copy trading solution—FBS Copytrade, while once available, isn't as user-friendly or prominently featured as those offered by competitors, closed in 2022, restricting beginners' access to simpler trading approaches.
WikiFX Broker
Latest News
Brazilian Man Charged in $290 Million Crypto Ponzi Scheme Affecting 126,000 Investors
Become a Full-Time FX Trader in 6 Simple Steps
ATFX Enhances Trading Platform with BlackArrow Integration
IG 2025 Most Comprehensive Review
SEC Drops Coinbase Lawsuit, Signals Crypto Policy Shift
Construction Datuk Director Loses RM26.6 Mil to UVKXE Crypto Scam
Should You Choose Rock-West or Avoid it?
Franklin Templeton Submitted S-1 Filing for Spot Solana ETF to the SEC on February 21
Scam Couple behind NECCORPO Arrested by Thai Authorities
Top Profitable Forex Trading Strategies for New Traders
Currency Calculator


