简体中文
繁體中文
English
Pусский
日本語
ภาษาไทย
Tiếng Việt
Bahasa Indonesia
Español
हिन्दी
Filippiiniläinen
Français
Deutsch
Português
Türkçe
한국어
العربية
GBP/USD Forecast: Navigating the Market's Ups and Downs
Abstract:Analyzing Key Signals in the GBP/USD Currency Pair

Analyzing Key Signals in the GBP/USD Currency Pair
Technical Analysis: The GBP/USD's Downward Journey
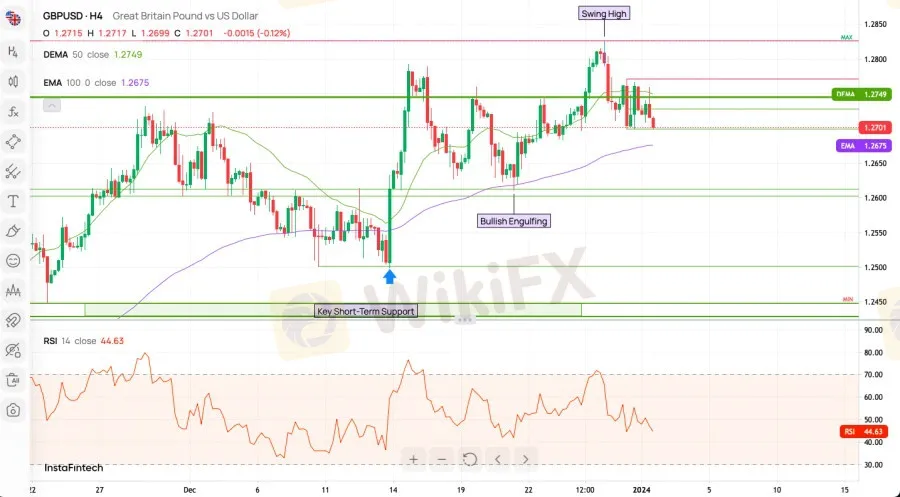
As of January 2, 2024, the GBP/USD pair has been testing critical support levels. The pair touched the intraday low at 1.2700, with bearish pressure suggesting possible further declines to 1.2675 (100 EMA) and 1.2615. The momentum indicates that bears currently have the upper hand in the market.
Indicator Analysis
- DEMA (50 Close): 1.2749.
- EMA (100 Close): 1.2675.
Relative Strength Index (RSI):
- The RSI reads at 44.63, suggesting a balanced market with potential for both upward and downward movements.
Market Dynamics
The recent 'Bullish Engulfing' pattern is crucial. If the GBP/USD stays above key support levels and the DEMA, it might signal a recovery. However, a break below the 100 EMA could tilt the market towards further bearish trends.
Weekly Pivot Points:
- Resistance Levels: WR3 - 1.28261, WR2 - 1.27709, WR1 - 1.27522.
- Pivot Level: 1.27157.
- Support Levels: WS1 - 1.26970, WS2 - 1.26605, WS3 - 1.26053.

Trading Outlook
On the weekly chart, a Bullish Engulfing pattern emerged post-breakout above 1.2340, indicating bullish dominance. The market trading above the 50 WMA and 100 WMA sets the next bull target at the 2023 high of 1.3141. On the contrary, a sustained drop below 1.1802 raises the likelihood of a significant bearish trend, potentially down to 1.1494.
H1 Intraday Indicator Signals
- Majority (17 out of 21) technical indicators signal 'Sell'; 4 remain Neutral.
- All 18 moving averages signal 'Sell'.
Sentiment Scoreboard
- General sentiment is bullish (57% bulls vs. 43% bears). This bullish trend continues from last week (60% bulls) and the past three days (58% bulls).
Conclusion: Insights for Traders
For Bulls:: A sustained position above key support levels could indicate an ongoing recovery. Keep an eye on the resistance levels for signs of a bullish continuation.
For Bears: Watch for breaks below support levels, especially the 100 EMA, as this could signal further declines.

Disclaimer:
The views in this article only represent the author's personal views, and do not constitute investment advice on this platform. This platform does not guarantee the accuracy, completeness and timeliness of the information in the article, and will not be liable for any loss caused by the use of or reliance on the information in the article.
Read more

When High Returns Go Wrong: How a Finance Manager Lost RM364,000
A finance manager in Malaysia lost more than RM364,000 after falling victim to an online investment scam that promised quick and high returns.

Experienced Forex Traders Usually Do This Before Making a Lot of Money
If you’ve ever wondered what sets successful forex traders apart from the rest, one thing is clear: experience teaches them never to rush into a trading relationship without doing their homework. Whether you're a seasoned trader or just starting out, the secret to long-term success in forex trading is a robust, well-informed decision when choosing a broker.

Why Is Crypto Booming in Online Trading Compared to Forex?
Know why cryptocurrencies are booming in online trading, offering forex traders new opportunities, higher volatility, and the potential for greater returns.

What Can Forex Traders Learn from Ne Zha?
The animated blockbuster Ne Zha: Birth of the Demon Child tells the story of Ne Zha’s journey to defy fate and take control of his own destiny. Beyond being an inspiring tale filled with action and character growth, the film conveys profound life lessons - many of which resonate deeply with the world of forex trading.
WikiFX Broker
Latest News
Why Are Financial Firms Adopting Stablecoins to Enhance Services and Stability?
Experienced Forex Traders Usually Do This Before Making a Lot of Money
Octa vs XM:Face-Off: A Detailed Comparison
When High Returns Go Wrong: How a Finance Manager Lost RM364,000
Bridging Trust, Exploring Best—WikiEXPO Hong Kong 2025 Wraps Up Spectacularly
Fidelity Investments Explores Stablecoin Innovation in Digital Assets Sector
Interactive Brokers Expands Crypto Trading with Solana, XRP, Cardano, and Dogecoin
SEC Ends Crypto.com Probe, No Action Taken by Regulator
Why More People Are Trading Online Today?
Broker Comparison: FXTM vs XM
Currency Calculator


