简体中文
繁體中文
English
Pусский
日本語
ภาษาไทย
Tiếng Việt
Bahasa Indonesia
Español
हिन्दी
Filippiiniläinen
Français
Deutsch
Português
Türkçe
한국어
العربية
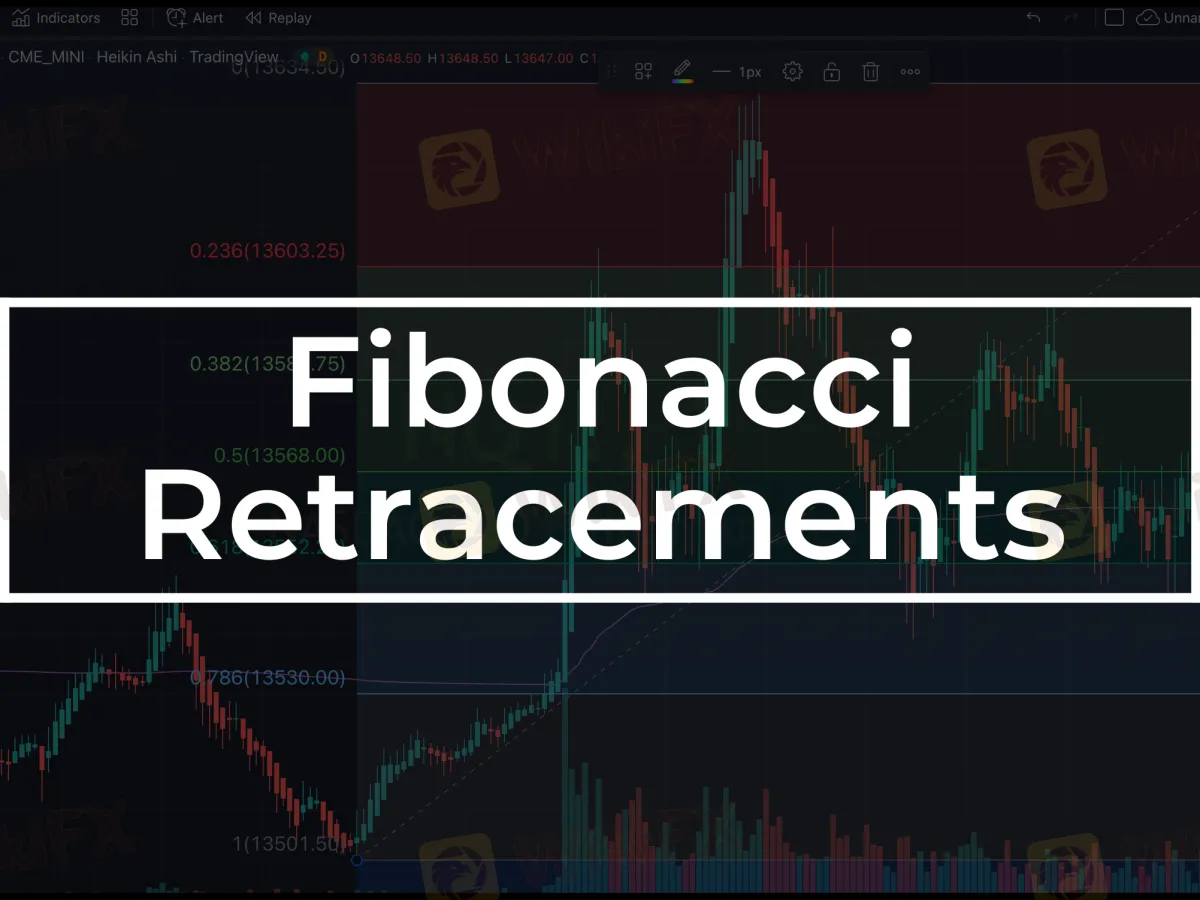
How to Use Fibonacci Retracements
Abstract:Fibonacci retracement is widely utilized in technical analysis. Traders leverage Fibonacci retracement to identify levels of price correction by drawing horizontal lines on price charts, marking potential support and resistance levels. This aids in predicting price adjustments and reversals, enabling traders to better grasp market trends and formulate effective trading strategies.

In the field of technical analysis in financial markets, Fibonacci retracement is a widely employed tool that assists traders in identifying potential support and resistance levels, aiding in the formulation of more informed trading decisions. This article delves into the effective utilization of Fibonacci retracement for technical analysis, helping you gain a better understanding of market trends and price fluctuations. Firstly, we will provide a brief overview of the fundamental concepts of Fibonacci retracement. Subsequently, we will combine theoretical explanations with practical examples to explore the application of Fibonacci retracement in forex trading. Whether you are a novice or a seasoned forex trader, through studying this article, you will be able to proficiently apply Fibonacci retracement, enhance your analytical skills, and achieve better trading results.
Basic Concepts of Fibonacci Retracement
Historical Background and Development
The concept of Fibonacci retracement originates from the Fibonacci sequence, a mathematical series introduced by the 13th-century Italian mathematician Fibonacci. Each number in the Fibonacci sequence is the sum of the two preceding numbers, forming a sequence like 0, 1, 1, 2, 3, 5, 8, 13, 21, and so on. The ratio of consecutive numbers in this sequence gradually approaches a constant, known as the golden ratio (approximately 1.618). This magical ratio finds widespread applications or discoveries in various fields such as art, architecture, the natural world, and financial markets.

In architecture, iconic structures like the Parthenon, Egyptian pyramids, the Louvre Museum in Paris, and the Sydney Opera House all incorporate the golden ratio. In art, compositions in famous works like Leonardo da Vinci's “Mona Lisa” and “The Last Supper,” as well as Vincent van Gogh's “Starry Night,” reveal traces of the golden ratio. In the natural world, phenomena like the arrangement of plant petals and seeds, celestial movements, and cloud shapes all exhibit the presence of the golden ratio, despite initially appearing unrelated.
Later on, this sequence found extensive application in financial markets, including Fibonacci retracement and wave theory. The concept of Fibonacci retracement was introduced in the early 20th century and has since been widely employed in technical analysis. Traders use Fibonacci retracement to identify levels of price correction by drawing horizontal lines on price charts, marking potential support and resistance levels. This aids in predicting price adjustments and reversals, allowing traders to better grasp market trends and formulate effective trading strategies.
Application Example of Fibonacci Retracement
Upward Trend
Below is the daily chart of GBP/USD.

Here, we draw Fibonacci retracement levels by clicking on the low point of the price swing on September 26 (1.0352) and dragging the cursor to the high point on December 14 (1.2436).
The charting software has automatically calculated and displayed the Fibonacci retracement levels.
From the chart, the Fibonacci retracement levels are 1.1958 (23.6%), 1.1651 (38.2%), 1.1403 (50.0%*), 1.1155 (61.8%), and 1.0802 (78.6%).
Starting from the highest point, we anticipate that if GBP/USD retraces from recent highs, it will find support at one of these Fibonacci retracement levels. As prices fall, traders are likely to place buy orders at these levels, either due to the widespread use of Fibonacci retracement as an analytical tool or because market patterns and experience suggest resistance at these points. Nonetheless, the cause and effect of events are not always as clear as in this magical universe.
Now, let's see what actually happened after the high point.

The price retraced to the 23.6% level within a month, found support around this level, and then rebounded towards the high point without breaking through.
Subsequently, the price tested the 23.6% level again, nearly reaching the 38.2% level but failing to close below it.
Around March 15, the market resumed its upward trend, eventually breaking through the high point of the range.
Clearly, in this example, buying between the 23.6% and 38.2% Fibonacci levels would have been a profitable long-term trade!
Downward Trend
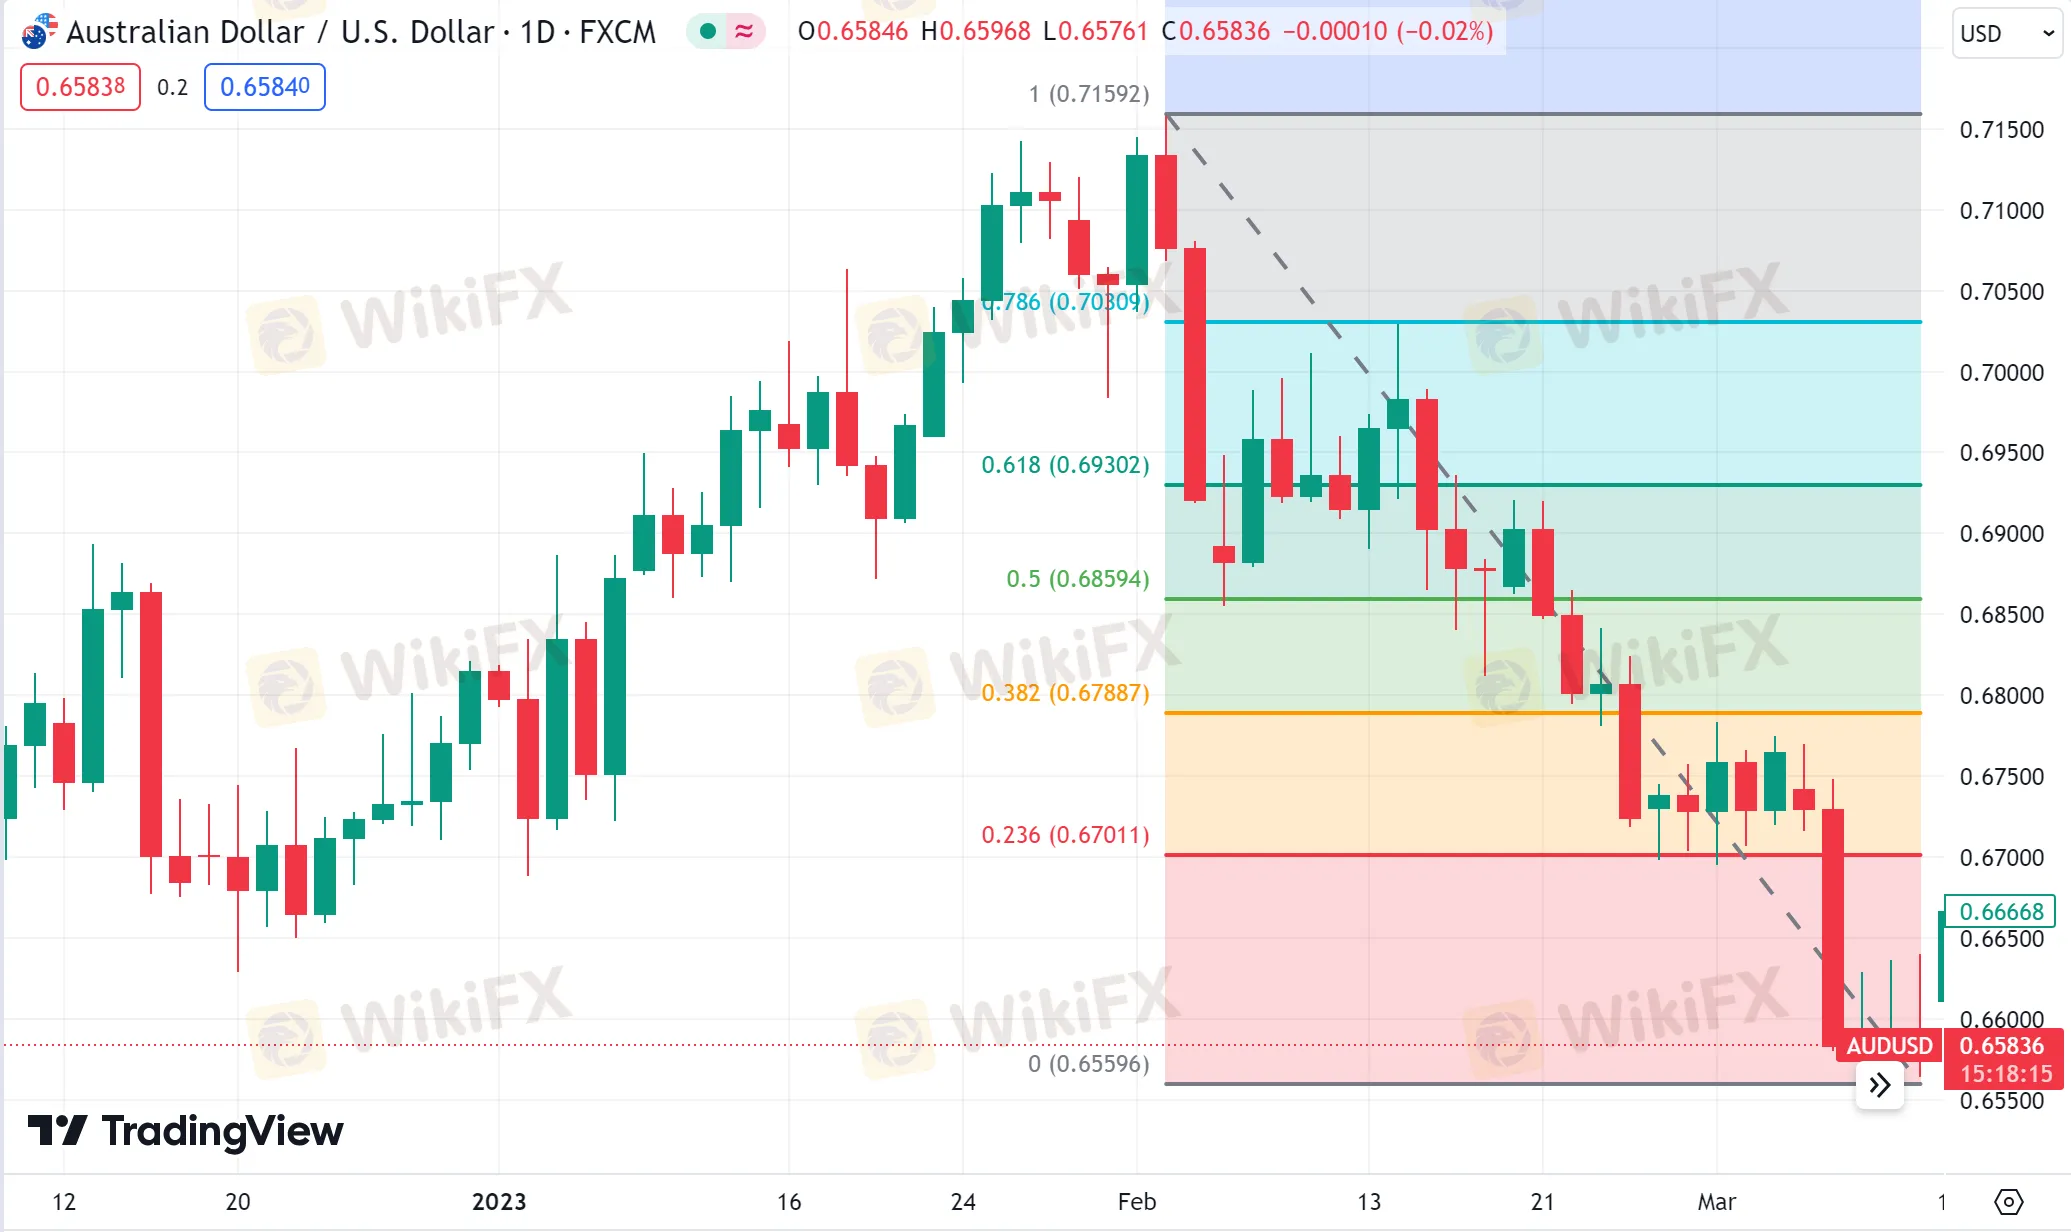
Now, let's explore how to utilize the Fibonacci retracement tool in a downward trend. Below is the daily chart of AUD/USD.

As you can see, we identified the swing high at 0.7159 on February 2 and the swing low at 0.6556 on March 10, about a month later. Similarly, by selecting these two points, the charting software automatically calculates and displays the Fibonacci retracement levels.
The retracement levels are 0.6701 (23.6%), 0.6789 (38.2%), 0.6859 (50.0%), 0.6930 (61.8%), and 0.7031 (78.6%).
The expectation for a downward trend is that if the price retraces from this low point, it might encounter resistance at one of the Fibonacci levels. Traders looking to participate in the downward trend at better prices may already be prepared to place sell orders there.

Observing the subsequent market movements, it becomes evident that the market indeed attempted to rebound. Testing the 38.2% level three times within the next two months, it failed to break through and fell to a new phase low on May 31.
Therefore, we redraw the Fibonacci retracement levels, as shown in the chart below.

Continuing to observe the subsequent trends, we notice that the market accelerated its decline after testing the 50.0% level twice.
Hence, two possible strategies can be considered:
Go short on AUD/USD at any of the three instances of testing the 38.2% level and take profits when it falls to the new low.
After the new low is established, use the new Fibonacci retracement levels as a reference, go short on AUD/USD at any of the two instances of testing the 50.0% level, and take profits at an appropriate future point.
In this example, either of the strategies, based on using the Fibonacci retracement tool, could yield decent profits.
Certainly, whether in an upward or downward trend, one thing to note is that prices do not always reverse from these levels. It is advisable to conduct a comprehensive analysis by incorporating other indicators, such as MACD, ADX, RSI, and so on. The application methods of these indicators can be referred to in our other articles.
Other Considerations
If some of your orders are at the 38.2% or 50.0% levels, you may experience some erratic spreads in that particular trade.
In both of these examples, we observe that prices found temporary forex support or resistance at Fibonacci retracement levels. These levels become self-fulfilling support and resistance levels due to the widespread use of Fibonacci tools by market participants.
If a sufficient number of market participants believe that a retracement will occur near a Fibonacci retracement level and wait to open positions when the price reaches that level, all these pending orders could potentially impact market prices.

Pros and Cons of Fibonacci Retracement
Pros
Identify Support and Resistance Levels
Fibonacci retracement helps traders identify potential support and resistance levels, aiding in predicting price adjustments and reversal points.
Combines with Trend Analysis
When used in conjunction with trend analysis, Fibonacci retracement helps traders confirm the primary trend in the market and find suitable entry points.
User-Friendly
Drawing and understanding Fibonacci retracement is relatively simple, making it suitable for traders at different levels, from beginners to professionals.
Provides Potential Buy/Sell Signals
Reversals near Fibonacci levels may provide potential buy or sell signals, assisting in formulating trading strategies.
Cons
Subjectivity
The use of Fibonacci retracement relies on the subjective judgment of the analyst, and different analysts may draw different conclusions on the same chart.
Risk of Overuse
Traders may sometimes overuse Fibonacci retracement, applying it to any market situation, leading to erroneous trading decisions.
Market Noise Interference
In situations with significant market noise, prices may fluctuate near Fibonacci levels, making the analysis less accurate.
Not Suitable for All Markets
Fibonacci retracement may not perform well in certain markets and timeframes, as different markets may be influenced by different factors.
FAQs

Why is Fibonacci retracement important?
In technical analysis, Fibonacci retracement levels indicate key areas where a stock may reverse or stall. Common ratios include 23.6%, 38.2%, 50%, etc. These levels typically occur between the high and low points of a security, aiming to predict the future direction of its price movements.
How do you draw Fibonacci retracement lines?
Fibonacci retracement is drawn between two significant points on a chart, usually between the absolute low point and the absolute high point. Horizontal lines intersect at Fibonacci levels.
Is Fibonacci retracement suitable for day trading?
The Fibonacci retracement tool is one of the essential tools in day trading. It is used to identify reversal points and extension points.
Bottom Line
In the field of forex trading, Fibonacci retracement is widely utilized in technical analysis. Understanding its subtle pros and cons is crucial in maintaining a balanced trading strategy when dealing with both upward and downward trends. While Fibonacci retracement offers valuable insights, combining it with other indicators enhances comprehensive analysis. Always exercise caution and consider the broader market context while leveraging its simplicity and potential. Remember, a well-rounded approach contributes to successful trading!
Disclaimer:
The views in this article only represent the author's personal views, and do not constitute investment advice on this platform. This platform does not guarantee the accuracy, completeness and timeliness of the information in the article, and will not be liable for any loss caused by the use of or reliance on the information in the article.
Read more

Bank Negara Malaysia Flags 12 New Companies for Unauthorised Activity
Bank Negara Malaysia (BNM) has updated its Financial Consumer Alert List (FCA List) by adding 12 more entities, reinforcing its efforts to warn the public against unregulated financial schemes. Check if your broker made the list!

TradingView Brings Live Market Charts to Telegram Users with New Mini App
TradingView has launched a mini app on Telegram, making it easier for users to track market trends, check price movements, and share charts.

USD/INR, USD/PHP Forecast April 2025
The global forex markets are bracing for April 2025 with divergent forecasts for key emerging market pairs. In particular, the USD/INR and USD/PHP pairs have attracted significant attention amid a mix of central bank interventions, evolving U.S. policy signals, and regional economic shifts. In this article, we review multiple forecasts, examine the driving factors, and outline what traders might expect as the month unfolds.

April Forex Trends: EUR/USD, GBP/USD, USD/JPY, AUD/USD, USD/CAD Insights
Know April’s forex seasonality trends for EUR/USD, GBP/USD, USD/JPY, AUD/USD, and USD/CAD. Historical insights and key levels to watch in 2025.
WikiFX Broker
Latest News
Exposing the Top 5 Scam Brokers of March 2025: A Closer Look by WikiFX
Gold Prices Climb Again – Have Investors Seized the Opportunity?
Webull Launches SMSF Investment Platform with Zero Fees
Australian Regulator Warns of Money Laundering and Fraud Risks in Crypto ATMs
The Withdrawal Trap: How Scam Brokers Lure Victims into Paying More
FCA to Investors: Think Twice Before Trusting These Brokers
Trump\s tariffs: How could they affect the UK and your money
Trump gambles it all on global tariffs he\s wanted for decades
TradingView Brings Live Market Charts to Telegram Users with New Mini App
HTFX Spreads Joy During Eid Charity Event in Jakarta
Currency Calculator


