简体中文
繁體中文
English
Pусский
日本語
ภาษาไทย
Tiếng Việt
Bahasa Indonesia
Español
हिन्दी
Filippiiniläinen
Français
Deutsch
Português
Türkçe
한국어
العربية


US Household Net Worth Collapses by Nearly $4 Trillion
概要:US Household Net Worth falls by most since the financial crisis to $104.3 Trillion at the end of 2018.
4Q 2018 US HOUSEHOLD NET WORTH – TALKING POINT
Household Net Worth in the US for 4Q fell to $104 Trillion from $108 Trillion in the period prior
A widespread selloff in risk assets at the end of 2018 sent stock prices tumbling lower and labeled as the primary contributor to the 3.5 percent decline in US household wealth
Check out the free DailyFX Building Confidence in Trading Guide for tips on how to sharpen your trading skills!
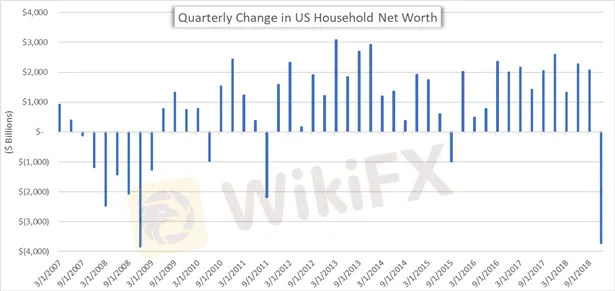
Household wealth in the United States dipped by 3.5 percent, a decline of $3.7 Trillion, over 4Q 2018 driven primarily by a cratering stock market. US Household Net Worth of $104.3 Trillion at the end of year compares to third quarters reading of $108 Trillion.The report for the current period showed the largest drop in household wealth since the Great Financial Crisis.
US HOUSEHOLD NET WORTH PRICE CHART: QUARTERLY TIME FRAME (JANUARY 2007 TO DECEMBER 2018)
Immediately following the report, the US Dollar was little changed but upward momentum looks to fade following solid gains made earlier in todays session.
DXY US DOLLAR INDEX CURRENCY PRICE CHART: 1-MINUTE TIME FRAME (MARCH 07, 2019 INTRADAY)

Unsure about the USD‘s next direction? Download the free USD Forecast for comprehensive insight from DailyFX’s analyst on the currencys outlook!
The $3.9 Trillion decline in financial assets over the months of October through December was widely attributable to the near 20 percent slide in US equity prices. Although, the decline was partially offset by a modest $300 Billion rise in the value of real estate.
DOW JONES INDUSTRIAL AVERAGE INDEX PRICE CHART: DAILY TIME FRAME (OCTOBER 01, 2018 TO DECEMBER 31, 2018)

The report also showed that domestic nonfinancial debt grew at a 2.7 percent seasonally adjusted annual rate which is lower than the 4.5 percent rate reported in 3Q 2018. However, household debt still climbed $241 Billion over the final quarter of the year. Also noteworthy from the release was the slide in the personal savings rate from 3.53 percent to 3.07 percent.
免責事項:
このコンテンツの見解は筆者個人的な見解を示すものに過ぎず、当社の投資アドバイスではありません。当サイトは、記事情報の正確性、完全性、適時性を保証するものではなく、情報の使用または関連コンテンツにより生じた、いかなる損失に対しても責任は負いません。
WikiFXブローカー
話題のニュース
WikiFX「3·15 外国為替権利デー」、ブラックリストを正式に発表
 WikiFX
FX投資における悪徳業者リスクの回避~ライセンス規制からリスクを見抜く方法を解説
WikiFXデジタル時代の新たな貧困ビジネス~SNSに蔓延する「成功保証」が若者を食い物にする
WikiFX日本、暗号資産の税率引き下げへ、ビットコイン準備金には慎重姿勢
WikiFX桜が舞う春、WikiFXのデモ取引大会で賞金30万円を手に入れよう!
WikiFXレート計算

