简体中文
繁體中文
English
Pусский
日本語
ภาษาไทย
Tiếng Việt
Bahasa Indonesia
Español
हिन्दी
Filippiiniläinen
Français
Deutsch
Português
Türkçe
한국어
العربية


S&P 500 Sinks with Health-Care Stocks as NZD/USD Could Reverse
概要:The S&P 500 closed lower as health-care stocks dragged and triggered risk aversion after key resistance held. NZD/USD may reverse as the Australian Dollar rises on a jobs report.
The pro-risk New Zealand Dollar was the worst-performing major on Wednesday, initially weighed down by disappointing local first quarter inflation data that fueled RBNZ rate cut bets further. NZD/USD losses extended later on during the Wall Street trading session where the S&P 500 closed 0.23% lower as resistance held just under 2916.
US stocks were weighed down by health-care, with UnitedHealth Group sinking to its lowest close in over a year. The company is a bellwether when looking at the US insurance field. Yesterday after their earnings reports, CEO David Wichmann highlighted concerns over “Medicare-for-All” which is a growing issue in the political landscape leading up to the 2020 US Presidential Election.
S&P 500 Weighed Down by Health-Care
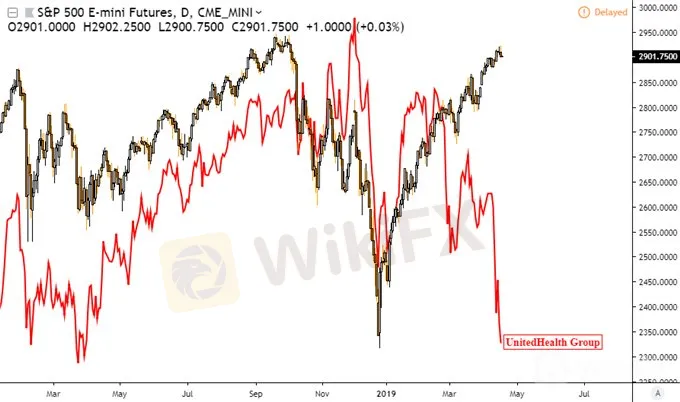
Chart Created in TradingView
US front-end government bond yields declined alongside the S&P 500, suggesting that there was a bout of risk aversion. The highly liquid US Dollar appreciated, but it was not enough to counter earlier declines in the aftermath of better-than-expected first quarter China GDP data. The Canadian Dollar rose following a couple of upside surprises in local CPI statistics for the March period.
Thursdays Asia Pacific Trading Session
Ahead, the Australian Dollar will be looking towards Marchs domestic jobs report. Lately, the Citi Economic Surprise Index has been suggesting that perhaps there may a rosy outcome. This is because Australian economic data has been tending to increasingly outperform relative to economists expectations as of late. However, the anti-risk AUD/USD's upward price movement may be offset if Asia equities follow Wall Street lower.
NZD/USD Technical Analysis
Despite its downside performance on Wednesday, NZD/USD prices were unable to breach near-term support at 0.6706 on the chart below. This comes after breaking under a couple of rising trend lines, one from October 2018 and another from January this year (pink lines below). We are starting to see positive RSI divergence, which shows fading downside momentum. As such, NZD bears ought to proceed with caution.
NZD/USD Daily Chart

Chart Created in TradingView
免責事項:
このコンテンツの見解は筆者個人的な見解を示すものに過ぎず、当社の投資アドバイスではありません。当サイトは、記事情報の正確性、完全性、適時性を保証するものではなく、情報の使用または関連コンテンツにより生じた、いかなる損失に対しても責任は負いません。
WikiFXブローカー
話題のニュース
WikiFX「3·15 外国為替権利デー」、ブラックリストを正式に発表
 WikiFX
FX投資における悪徳業者リスクの回避~ライセンス規制からリスクを見抜く方法を解説
WikiFXレート計算

