简体中文
繁體中文
English
Pусский
日本語
ภาษาไทย
Tiếng Việt
Bahasa Indonesia
Español
हिन्दी
Filippiiniläinen
Français
Deutsch
Português
Türkçe
한국어
العربية


S&P 500 Forecast: Stocks Threaten Breakdown as TLT ETF Soars
概要:The S&P 500 fluctuated between losses and gains on Thursday before finishing narrowly higher. Meanwhile, investors continued to clamor for safety in bonds.
S&P 500 Outlook:
Volatility remains abundant as stocks jostled throughout Thursday trading
The S&P 500 was able to eek out a daily close above two technical levels that could provide support headed into next week
Sign up for our Free Weekly Equity Webinar in which critical technical levels and fundamental themes are analyzed each week
S&P 500 Forecast: Stocks Threaten Breakdown as TLT ETF Soars
The S&P 500 closed 0.2% higher after paring losses established earlier in the session. While strong earnings from Walmart (WMT) and Alibaba (BABA) helped to stall declines, investors are still wary of an extended recovery – as evidenced by collapsing treasury yields. Consequently, the TLT ETF, which seeks to track the investment results of an index composed of U.S. Treasury bonds with remaining maturities greater than twenty years, touched all-time highs.
TLT ETF Price Chart: Daily Time Frame (2002 – 2019) (Chart 1)
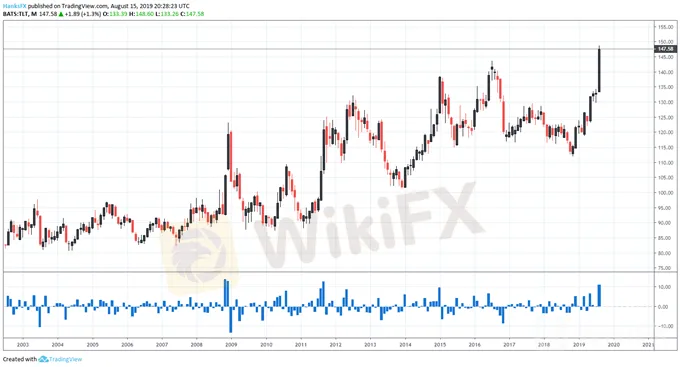
Chart created withTradingView
Coinciding with heightened stock market volatility and growing uncertainty about the health of the US economy, the TLT ETF is on pace for its largest 1-month return since September 2011 – with two more full trading weeks. Further, TLT boasts a return of nearly 21% in the year-to-date, now outpacing the S&P 500 and even Nasdaq 100 which have gained 13.5% and 17.8% in 2019 respectively. The continuous demand for safety speaks to the ongoing uncertainty among traders and has resulted in robust capital flows into TLT.
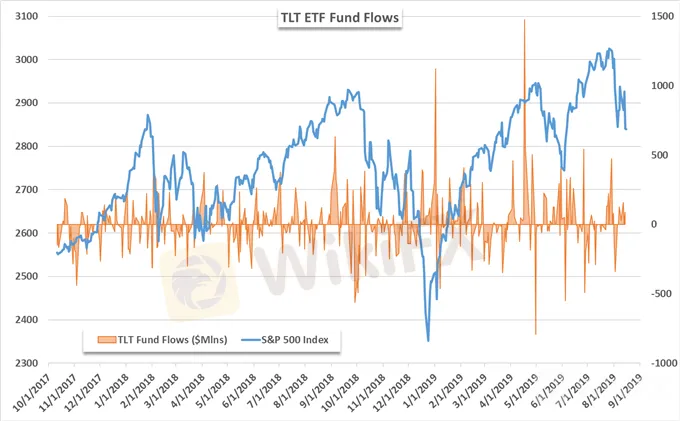
Boasting net inflows of nearly $4.8 billion in 2019, TLT is in the process of posting two-straight weeks of net inflows – despite forecasted Fed rate cuts. While an inversion of the yield curve and soaring demand for TLT paint a bleak picture for the S&P 500, the Index was able to narrowly close above a possible trendline heading into Friday trading. Further, strong earnings from Nvidia (NVDA) could look to bolster the tech sector and Nasdaq 100 as I outlined yesterday.
S&P 500 Price Chart: 4 – Hour Time Frame (June – August) (Chart 2)

Chart created withTradingView
After closing slightly above trendline support from June, traders could use the technical barrier as an excuse – or an opportunity – to explore long positions heading into the weekend. Fibonacci support is also nearby at the 2,840 level and bulls will look for any and all assistance they can get after the last two weeks of turmoil for the SPX. Should risk aversion reignite, subsequent support can be looked to at the 2,800 and 2,740 levels – with various areas of minor buoyance in between.
免責事項:
このコンテンツの見解は筆者個人的な見解を示すものに過ぎず、当社の投資アドバイスではありません。当サイトは、記事情報の正確性、完全性、適時性を保証するものではなく、情報の使用または関連コンテンツにより生じた、いかなる損失に対しても責任は負いません。
WikiFXブローカー
話題のニュース
WikiFX「3·15 外国為替権利デー」、ブラックリストを正式に発表
 WikiFX
FX投資における悪徳業者リスクの回避~ライセンス規制からリスクを見抜く方法を解説
WikiFXレート計算

