简体中文
繁體中文
English
Pусский
日本語
ภาษาไทย
Tiếng Việt
Bahasa Indonesia
Español
हिन्दी
Filippiiniläinen
Français
Deutsch
Português
Türkçe
한국어
العربية


Nasdaq 100 Price Forecast: Index Retakes September Peaks but Gaps Loom
概要:The Nasdaq 100 climbed higher on Wednesday to cement its status above the peaks from September 2018. Looking ahead, a continuation higher seems possible, but open air beneath looms large.
Nasdaq 100 Price Forecast:
A huge gap higher on Monday allowed the Nasdaq 100 to surpass key resistance around 7,700
Still, the tech-heavy Index enters the latter half of the week with significant open air beneath and if fundamental developments disappoint, the gaps could accelerate losses
Interested in equities? Check out the DailyFX Podcast with Andrew Milligan, head of global strategy at Aberdeen Standard Investments
Nasdaq 100 Forecast: Index Retakes September Peaks but Gaps Loom
After a hearty gap higher on Monday, the Nasdaq 100 retook the 7,700 level which marks prior peaks in September 2018. A brief retracement on Tuesday threatened those gains, but outstanding earnings from Target and Lowe‘s allowed it to retain them in Wednesday trading. That said, Monday’s gap leaves significant unfilled space beneath current levels and with an economic calendar packed with fundamental event risk, those gaps could look to accelerate losses if monetary policy remarks miss the markets lofty expectations.
Nasdaq 100 Price Chart: Daily Time Frame (December 2018 – August 2019) (Chart 1)
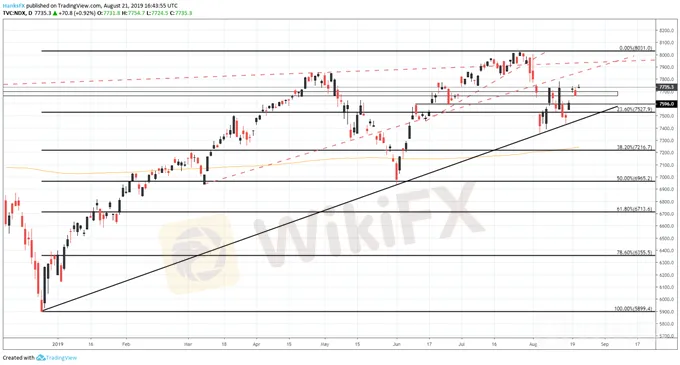
Chart created withTradingView
Therefore, 7,700 will be the initial level to watch for support if bearishness takes hold. Should the support give way, traders could look to fill the gap beneath which could see the Nasdaq quickly slip to 7,623 where minor support may assist bulls around 7,596. Slightly lower still, a confluence of support will look to rebuke bears around the 7,527 where a Fibonacci level intersects the ascending trendline from December.
Sign up for our Free Weekly Equity Webinar in which critical technical levels and fundamental themes are analyzed each week.
If, on the other hand, the July FOMC minutes or the Jackson Hole Symposium offer a positive surprise regarding the outlook of monetary policy, traders will likely use the remarks as fuel for a continuation higher. Initial resistance of note should be offered by the ascending trendline from March. While it has been broken numerous times, a gap beneath in early August suggests the area still holds some influence. A continuation higher will first need to overcome the level before it can target subsequent resistance around 7,935 and eventually all-time highs slightly above 8,000.
Nasdaq 100 Price Chart: 4 – Hour Time Frame (March – August) (Chart 2)

Chart created withTradingView
免責事項:
このコンテンツの見解は筆者個人的な見解を示すものに過ぎず、当社の投資アドバイスではありません。当サイトは、記事情報の正確性、完全性、適時性を保証するものではなく、情報の使用または関連コンテンツにより生じた、いかなる損失に対しても責任は負いません。
WikiFXブローカー
話題のニュース
WikiFX「3·15 外国為替権利デー」、ブラックリストを正式に発表
 WikiFX
FX投資における悪徳業者リスクの回避~ライセンス規制からリスクを見抜く方法を解説
WikiFXレート計算

