简体中文
繁體中文
English
Pусский
日本語
ภาษาไทย
Tiếng Việt
Bahasa Indonesia
Español
हिन्दी
Filippiiniläinen
Français
Deutsch
Português
Türkçe
한국어
العربية


S&P 500 Price Outlook: Value Stocks Outperform Momentum, Tech Lags
概要:After breaking outside of its August range, the road higher seemed to be laid out for the S&P 500, but tech and momentum stocks have been largely absent from the rally effort.
S&P 500 Price Forecast:
With the original technical pattern now called into question, buyers will need to appear quickly to prevent further losses
The momentum ETF (MTUM) saw its largest 2-day underperformance compared to the value ETF (VLUE) since 2013 when the funds were conceived
Dow Jones, Nasdaq 100, DAX 30, FTSE 100 Forecasts for the Week
S&P 500 Price Outlook: Value Stocks Outperform Momentum, Tech Lags
As I highlighted in my Nasdaq outlook on Monday, US Indices witnessed a bullish pop above their recent ranges, which initially seemed to signal appetite for a continuation higher. Contributing to the bullish outlook, equity gains were met with corresponding weakness in typical haven assets like gold, silver and treasury yields which effectively signaled a wider shift in sentiment. That said, Tuesday has delivered a different kind of risk aversion – one solely within the equity sphere.
S&P 500 Price Chart: Daily Time Frame (January 2017 – September 2019) (Chart 1)
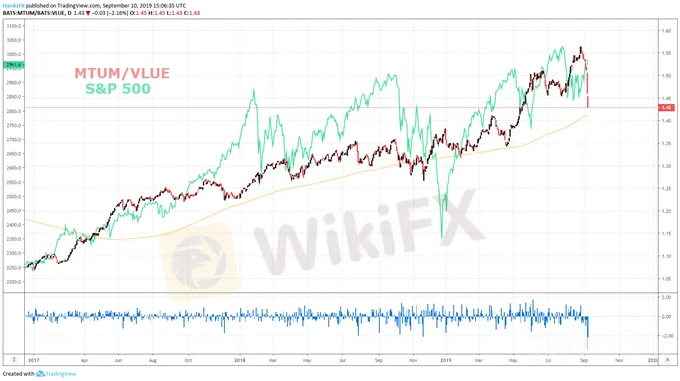
Chart created with TradingView. 1-day rate of change in blue.
Is Value the New Momentum?
The shift in risk appetite can be viewed in the disparity between the Momentum ETF (MTUM) and the Value ETF (VLUE). The former provides exposure to large and mid-cap stocks exhibiting relatively higher price momentum and the latter offers access to large and mid-cap shares with lower valuations based on fundamentals. The funds represent two popular, but fundamentally different, styles of investing and consequently - different risk and return profiles. Since their inception in 2013, the MTUM ETF has returned 149% compared to the 86% gain in the VLUE ETF.
Broadly speaking, the VLUE fund is the “safer” of the two ETFs and it is their relative performances in the last two days that has signaled a shift in attitude among some investors. Suffering the largest one and two-day underperformance relative to the VLUE ETF, MTUM has taken a notable blow as investors rotate into other areas of the market. The rotation can also be seen by the bearish price action on some of the streets most overbought names like Roku (ROKU), Switch (SWCH) and Shopify (SHOP).
S&P 500 Price Chart: Daily Time Frame (January – September) (Chart 2)

Chart created with TradingView.
General apprehensiveness to these high-flying and somewhat unproven stocks further signifies a subtle shift in the equity market. While the market in aggregate has traded only slightly lower, over-bought or extended stocks have taken the largest hit – despite their prior immunity in August. Similarly, some of the stocks responsible for large swathes of the price gains in the current bull market have also lagged – namely Microsoft (MSFT) and the broader QQQ ETF. While it is unsurprising to see relatively high-beta stocks underperform the broader market in times of turbulence, it is the rotation out of the entire momentum fund that makes the price action notable and potentially concerning.
S&P 500 Price Chart: Daily Time Frame (January – September) (Chart 3)

Chart created with TradingView. Technology ETF = XLK
In turn, recent bearishness has seen the S&P 500 threaten to break back into its recent range. A break beneath the upper bound around 2,940 could scuttle the technical pattern offered in early September and allow for the Index to plummet down to the lower bound once again. Teetering on trendline support from the fourth quarter of 2018, bulls will look to keep the S&P 500 above 2,961 and 2,940 in pursuit of a continuation higher.
S&P 500 Price Chart: 4 – Hour Time Frame (July – September) (Chart 4)

Chart created with TradingView.
免責事項:
このコンテンツの見解は筆者個人的な見解を示すものに過ぎず、当社の投資アドバイスではありません。当サイトは、記事情報の正確性、完全性、適時性を保証するものではなく、情報の使用または関連コンテンツにより生じた、いかなる損失に対しても責任は負いません。
WikiFXブローカー
話題のニュース
WikiFX「3·15 外国為替権利デー」、ブラックリストを正式に発表
 WikiFX
FX投資における悪徳業者リスクの回避~ライセンス規制からリスクを見抜く方法を解説
WikiFXレート計算

