简体中文
繁體中文
English
Pусский
日本語
ภาษาไทย
Tiếng Việt
Bahasa Indonesia
Español
हिन्दी
Filippiiniläinen
Français
Deutsch
Português
Türkçe
한국어
العربية


US Dollar Weekly Price Outlook: DXY Rally Faces Moment of Truth

요약:The US Dollar Index is approaching price levels that could threaten the recent recovery at fresh yearly highs. Here are the levels that matter on
Updated weekly technicals on the US Dollar Index (DXY) – Rally at risk sub-97.42
Check out our 2019 projections in our Free DailyFX USD Trading Forecast
Join Michael for Live Weekly Strategy Webinars on Mondays at 12:30GMT
In this series we scale-back and look at the broader technical picture to gain a bit more perspective on where we are in trend. The US Dollar Index is up nearly 1.5% since the start of the month with the greenback building on the late-January recovery. Price is now approaching resistance levels that could threaten the near-term advance heading deeper into February trade. These are the updated targets and invalidation levels that matter on the DXY weekly chart. Review this weeks Strategy Webinar for an in-depth breakdown of this setup and more.
New to Forex Trading? Get started with this Free Beginners Guide
DXY Weekly Price Chart (US Dollar Index)
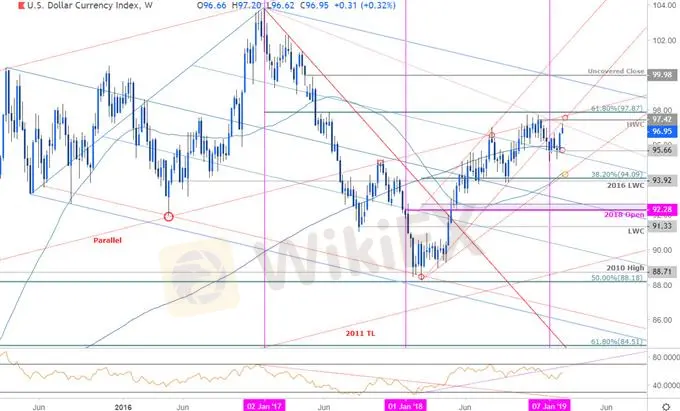
Notes: In last month‘s DXY Weekly Technical Outlook our ’bottom line noted that the dollar had, “turned from a multi-year slope inflection with price now threatening a break of below 2018 uptrend support. IF price is indeed heading lower, advances should be capped by 97.42 with a break lower from here targeting the critical support confluence around the 94-handle.”
The index failed to close below the 38.2% line of the descending 2015/2017 pitchfork (blue) with the recovery now testing basic trendline resistance extending off the 2017 & 2018 highs (red). Weekly resistance remains with the high-week close a 97.42 with a breach above key resistance at 97.87 needed to fuel the next leg higher in the Dollar. Yearly open support rests at 95.66 with a break / close below the weekly low-close at 95.62 needed to put the shorts back in control targeting the 200-week moving average / 2018 trendline around ~94.40s.
For a complete breakdown of Michaels trading strategy, review his Foundations of Technical Analysis series on Building a Trading Strategy
Bottom line: The US Dollar rally is approaching levels that could threaten the recovery with the advance at risk ahead of 97.42. From a trading standpoint, a good spot to reduce long-exposure / raise protective stops. Well be on the lookout for possible price exhaustion in this region to offer near-term opportunities for a pullback.
Even the most seasoned traders need a reminder every now and then- Avoid these Mistakes in your trading
---
Relevant US Economic Data Release

Economic Calendar - latest economic developments and upcoming event risk. Learn more about how we Trade the News in our Free Guide!
Previous Weekly Technical Chart
Euro (EUR/USD)
Gold (XAU/USD)
Japanese Yen (USD/JPY)
Euro vs Japanese Yen (EUR/JPY)
Canadian Dollar (USD/CAD)
New Zealand Dollar (NZD/USD)
Crude Oil (WTI)
British Pound (GBP/USD)
면책 성명:
본 기사의 견해는 저자의 개인적 견해일 뿐이며 본 플랫폼은 투자 권고를 하지 않습니다. 본 플랫폼은 기사 내 정보의 정확성, 완전성, 적시성을 보장하지 않으며, 개인의 기사 내 정보에 의한 손실에 대해 책임을 지지 않습니다.
WikiFX 브로커
환율 계산기

