简体中文
繁體中文
English
Pусский
日本語
ภาษาไทย
Tiếng Việt
Bahasa Indonesia
Español
हिन्दी
Filippiiniläinen
Français
Deutsch
Português
Türkçe
한국어
العربية


Gold Price Eyeing Support, Silver Price Rebound Fading

Абстракт:Golds short-term rally has hit the buffers and may test 200-day ma support again while silver remains stuck in a downtrend.
Gold (XAU) and Silver (XAG) Price Analysis and Charts.
黄金(XAU)和白银(XAG)价格分析和图表。
Gold (XAU) – Will 200-dma bounce hold?
黄金(XAU) - 200-dma反弹会持续吗?
Silver (XAG) – Lower highs and lower lows.
白银(XAG) - 较低的高点和低点。
DailyFX Q2 Forecasts and Top 2019 Trading Opportunities.
DailyFX Q2预测和2019年顶级交易机会。
Gold (XAU) Price Respecting Lower Highs
黄金(XAU)价格走低至高位
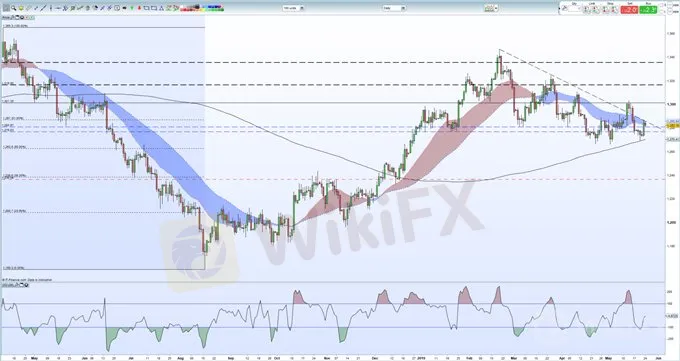
The price of gold is currently trading just below a series of lower highs initiated off the February 20 peak at $1,346/oz. after bouncing off support from the 200-day moving average on Tuesday this week. The narrowing of the recent trading range may provoke a break-out in the coming days with $1,287/oz, the 61.8% Fibonacci retracement level and this weeks high the first level of resistance. To break the series of lower highs, gold needs to trade above the May 14 high at $1,303/oz, a level that will need a strong fundamental driver to be breached. To the downside, the 200-day moving average is currently around $1,270.5/oz. This technical indicator held and prompted a reversal on Tuesday this week, although the rebound was short-lived. Below here, $1,266/oz. stands in the way of a re-test of 50% Fibonacci retracement at $1,262.8/oz.
目前黄金价格低于2月20日高点开始的一系列较低高点$ 1,346 /盎司。在本周二的200日移动平均线反弹支撑后。近期交易区间的缩小可能会引发未来几天突破1,287美元/盎司,61.8%斐波纳契回撤位以及本周高阻力位。为打破一系列较低的高位,黄金需要在5月14日的高位上方交易至1,303美元/盎司,这个水平需要强大的基本驱动力才能被突破。不利的是,200日均线目前约为1,270.5美元/盎司。尽管反弹是短暂的,但这个技术指标在本周二举行并反转。在这下面,$ 1,266 / oz。阻碍50%斐波那契回撤位于1,262.8美元/盎司的重新测试。
Gold (XAU) Daily Price Chart (May 2018 – May 24, 2019)
黄金(XAU)每日价格走势图(2018年5月 - 2019年5月24日)
Silver (XAG) – Bear Channel Still in-Play
Silver(XAG) - Bear Channel仍在播放中
{10}
Silver bounced off a six-month low at $14.38 earlier this week and pushed marginally higher but the move still looks weak as a new lower low and a lower high were put in place. Silver continues to respect the downtrend and a re-test of this weeks low is possible if bearish momentum continues. Silver has also been respecting the 20-day moving average since late-March, while both the shorter-dated moving averages fell through the longer-dated (200-day) ma recently, adding to bearish sentiment. A break lower would target, $14.05, the November 30 low, psychological support at $14.00 before a full re-trace back to the November 14 low at $13.89.
{10}
Silver (XAG) Daily Price Chart (August 2018 - May 24, 2019)
银(XAG)每日价格图表(2018年8月 - 2019年5月24日)

Trading the Gold-Silver Ratio: Strategies and Tips.
交易黄金 - 白银比率:策略和提示。
IG Client Sentimentshows that retail traders are 78.8% net-long gold, a bearish contrarian indicator. Recent daily and weekly sentiment shifts however give us a mixed trading bias.
IG客户情绪显示零售交易商持有78.8%的净多头黄金,这是看跌的逆势指标。然而,最近的每日和每周情绪变化给我们带来了混合的交易偏见。
--- Written by Nick Cawley, Market Analyst
---由市场分析师Nick Cawley撰写
Отказ от ответственности:
Мнения в этой статье отражают только личное мнение автора и не являются советом по инвестированию для этой платформы. Эта платформа не гарантирует точность, полноту и актуальность информации о статье, а также не несет ответственности за любые убытки, вызванные использованием или надежностью информации о статье.
WikiFX брокеры
Подсчет курса

