USD/SEK, USD/NOK Break Through Key Support - Whats Next?
摘要:USD/SEK and USD/NOK broke through key support levels as US Dollar strength faded and short-term volatility is to be expected from central bank-related event risk this week.
NORDIC FX, SEK, NOK - WEEKLY MARKET OUTLOOK
USD/SEK, USD/NOK broke key support levels
Broader trajectory for pairs remains on upside
FOMC, Norges Bank likely to cause volatility
See our free guide to learn how to use economic news in your trading strategy!
SWEDISH KRONA TECHNICAL ANALYSIS
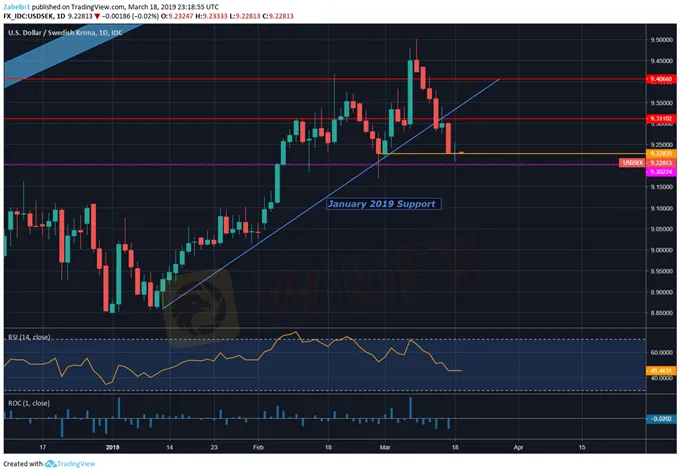
Last week, US Dollar weakness appeared to have been the catalyst in dragging down USD/SEK below the January 2019 rising support line. The pair is now sitting on the frequently-tested 9.2283 support. Another bounce from this level might show that overall sentiment for the pair still remains broadly bullish. The pairs aim may now be on breaching resistance at 9.3110 and using that as the new floor if prices turn lower again.
USD/SEK – Daily Chart
Zooming out, the pairs overall trajectory since the start of 2018 has showed a broad uptrend. The January 2018 support provided a strong foundation for the pair to ride on until its break in September. USD/SEK then broke into consolidation before trying to re-enter the rising support range from the beginning of 2018. However, underlying momentum failed to push the pair through it. What followed was a congestive period of indecision.
However, in 2019, the pair resumed its previous upward trajectory, and went on to achieve a 17-year high in early March. USD/SEKs atmosphere-puncturing rise was subsequently faded as negative RSI divergence illustrated ebbing upward momentum and US Dollar weakness prevailed. Despite a small pullback, fundamental factors suggest the pair will continue to climb.
USD/SEK – Daily Chart
NORWEGIAN KRONE TECHNICAL ANALYSIS
USD/NOK also recently broke through a key support level in what also appears to be the result of broad US Dollar weakness. The pair‘s descent looks to have been abruptly ended after bouncing back from the familiar support at 8.5261, a strong psychological floor. The pair’s aim may be to first re-enter the 8.5956-8.6323 resistance range before maybe resuming its previous incline.
USD/NOK – Daily Chart
Like USD/SEK, USD/NOK appears to be only having a small pullback from what looks like a broader uptrend originally starting from the sharp incline in September 2018. The pair broke through in early-January but then promptly resumed the previous uptrend at a less aggressive pace. The pair will likely continue to climb through the rest of the week, but central bank-related events may cause short-term volatility as markets price in a new outlook.
USD/SEK – Daily Chart
免责声明:
本文观点仅代表作者个人观点,不构成本平台的投资建议,本平台不对文章信息准确性、完整性和及时性作出任何保证,亦不对因使用或信赖文章信息引发的任何损失承担责任
天眼交易商
热点资讯
SILEGX投资骗局震惊全国!涉案金额高达4150万令吉,46人受害,含15名退休长者!
双面刽子手!FCA+ASIC全牌照高分IP Trade Nation正在地球村收割韭菜
币圈情侣在泰国芭提雅落网:诈骗+绑架,剧情堪比电影!
两万美刀利润不给,八百本金也被黑:民间高手遇到汇圈“茅坑里的石头”
筑信为桥,再攀新高——WikiEXPO 2025 香港站 精彩收官!
财务经理也栽了!Facebook股票投资骗局曝光,损失高达RM36.4万!
WikiEXPO全球专家访谈:戴金道——外汇交易的未来
美国追回700万美元!加密货币投资骗局受害者有望获赔,但谨防新骗局!
【WikiFX公告】模拟交易周赛暂停
汇率计算


