Gold Price Analysis: XAU/USD set to test 7-yr high
摘要:Gold Price Analysis: XAU/USD set to test 7-yr high
Gold looks to break Fridays range trade to the upside.
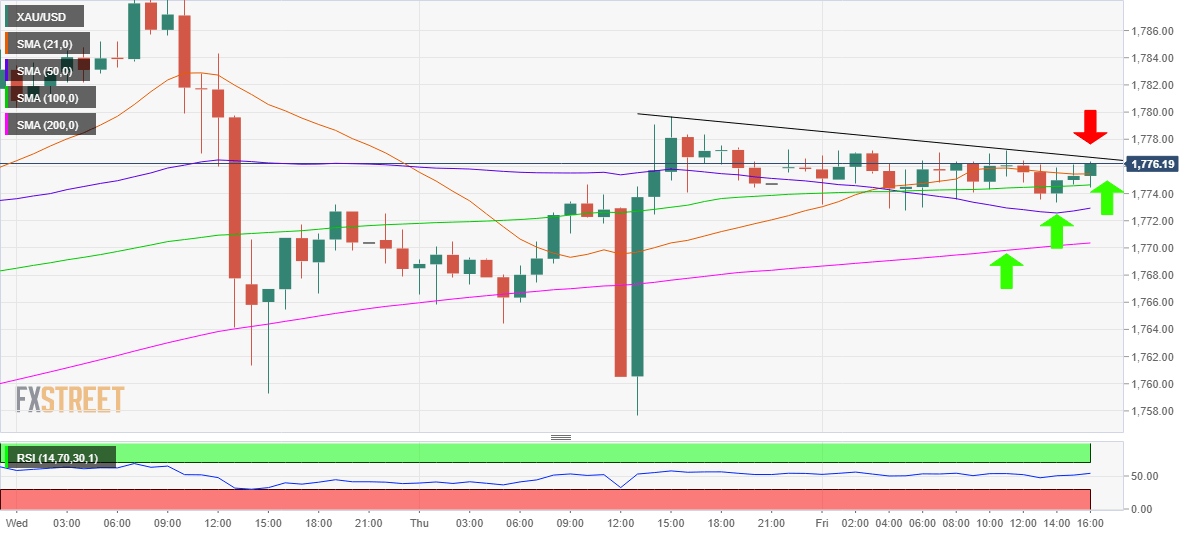
Falling trendline hurdle at $1776.60 is the level to beat for the bulls.
XAU/USD closed above all major hourly Simple Moving Averages (HMA).
Following consolidation in a $5 range on holiday-thinned Friday, Goldprices (XAU/USD) are poised for another leg higher after falling off the seven-year tops of $1789.28 last Wednesday.
With looming concerns over a surge in the coronavirus cases worldwide and economic recovery unlikely to wane, gold could likely continue drawing the haven bids in the near-tern.
Although the ongoing optimism on the global stocks could slowdown the yellow metals advances towards the $1800 mark.
Technically, looking at the hourly chart, gold is set to break through the falling trendline resistance aligned at $1776.60, also where Fridays high converges.
Acceptance above the latter could see a test of the multi-year high. The hourly Relative Strength Index (RSI) points northwards at 56.05, hinting at more room for the upside.
Also, the fact that the price closed above the 21-HMA at $1775.45 adds credence to the near-term bullish outlook. Its worth noting that the XAU bulls have regained ground above all the major HMAs.
On the flip side, the immediate downside could be capped by the 21-HMA, below which the next support awaits at the horizontal 100-HMA at $1774.64.
Further south, the 50-HMA at $1772.93 is likely to offer some temporary reprieve to the bulls while the 200-HMA at $1770.36 is the level to beat for the bears in the coming days.
All in all, the path of least resistance appears to the upside amid a lack of healthy resistancelevels.
Gold: Hourly chart

免责声明:
本文观点仅代表作者个人观点,不构成本平台的投资建议,本平台不对文章信息准确性、完整性和及时性作出任何保证,亦不对因使用或信赖文章信息引发的任何损失承担责任
天眼交易商
热点资讯
监管风险预警:这些外汇平台被吊销牌照或无证经营
特朗普加密货币峰会引爆市场,监管松动下加密资产迎来新机遇?
TriumphFX外汇投资骗局:马来西亚72宗报案,损失超2370万令吉!
寻找加密货币投资的真实价值:可扩展性、安全性和去中心化
两年遭冻结三千多万 先后经历四个黑平台,其中就有个冒充LUNO平台
玩不起?做油盈利5万刀出金被拒!“报价出错”是谁的遮羞布?
汇率计算


