


Stocks Eye European Data, Can S&P 500 Uptrend Pass Key Resistance?
摘要:Asia stocks traded mixed as markets await potentially risk-negative European data. In its near-term uptrend, can the S&P 500 break key resistance should sentiment prevail
Asia PacificMarkets Wrap Talking Point
APAC equities traded mixed after US markets were offline, Nikkei 225 rose
AUD/USD fell on RBA meeting minutes as dovish BoJ trimmed JPY gai
All eyes on German, Eurozone ZEW surveys. S&P 500 eyeing key resistance
Find out what retail traders equities buy and sell decisions say about the coming price trend!
After US markets were offline and a slight dose of risk aversion was added, Asia Pacific benchmark stock indexes traded mixed. The Nikkei 225 and ASX 200 saw gains ranging above 0.2% as we headed into Tuesday‘s close. China’s Shanghai Composite was relatively flat while South Koreas KOSPI aimed about 0.3% to the downside.
Looking at foreign exchange markets revealed a somewhat ‘risk-off’ trading dynamic. Both the sentiment-linked Australian and New Zealand Dollars traded lower against their major counterparts. As anticipated, the RBA meeting minutes ultimately sent AUD/USD to the downside as the central bank offered more details to their increasingly neutral policy outlook. This is as opposed to favoring a hike down the road.
While the anti-risk Japanese Yen was higher, gains were trimmed on dovish commentary from BoJs Governor Haruhiko Kuroda. This also offered a slight boost to the Nikkei 225. Looking ahead, S&P 500 futures are pointing narrowly lower. The upcoming German and Eurozone ZEW sentiment surveys may disappoint, fueling risk aversion and presenting knock-on effects for ASEAN currencies as the US Dollar appreciates.
S&P 500 Technical Analysi
These next few days will be quite interesting for the S&P 500 if sentiment ends up prevailing instead. Ahead lays a range of resistance between 2785.93 and 2816.94. Should this be cleared, it could set itself up for paring losses from its dramatic plunge towards the end of 2018. Should it turn lower in the interim, near term support appears to be a rising trend line from January.
S&P 500 Daily Chart
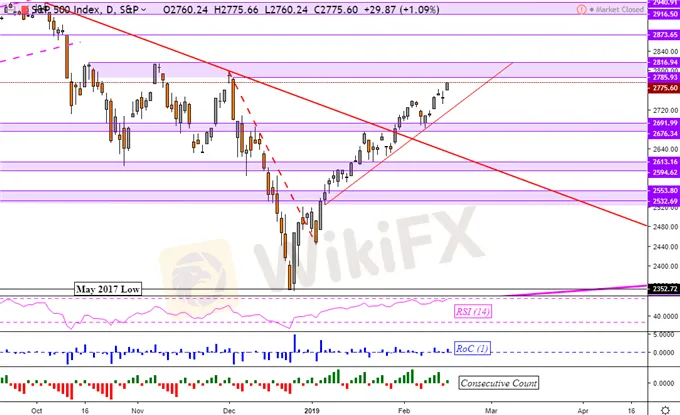
Chart created in TradingView
免責聲明:
本文觀點僅代表作者個人觀點,不構成本平台的投資建議,本平台不對文章信息準確性、完整性和及時性作出任何保證,亦不對因使用或信賴文章信息引發的任何損失承擔責任
天眼交易商
熱點資訊
Finaxen Trade Pips遭英國FCA點名示警,網站突然關閉疑爆雷跑路
 WikiFX
外匯交易失敗率那麼高、容易虧錢,為何還是很多人參與?
WikiFXWeltrade活動翻車?投資人怒曝領不到iPhone、獎勵被沒收,疑遭平台割韭菜
WikiFXPU Prime 推出活躍交易者專屬的 VPS 費用返還優惠
WikiFXLoyal Primus推高槓桿、低門檻、贈金多吸客,這家外匯券商可信嗎?
WikiFX又見高風險平台?Nova Finance監管疑似套牌,先後遭法國AMF、加拿大CSA示警
WikiFX一位交易者的心靈修行
WikiFX匯率計算

