


Gold Prices Approach April Low, Hold at Symmetrial Triangle Support
摘要:Recent changes in positioning suggest that, if a triangle breakout occurs, it would likely be to the downside.
When we last checked in on Gold prices a week ago, there was evidence (a weak US Dollar topping out) to suggest that more gains might be ahead for bullion. And while Gold prices initially rallied thereafter, the key developments that undercut the US Dollars appeal as a safe haven — dissipating concerns over the US-China trade war and Brexit – also served to undermine Gold.
In the past few days, the technical progress within the symmetrical triangle that has encapsulated price action since the start of 2019 has since been reversed. Gold prices have fallen back from near symmetrical triangle resistance and have rapidly approached symmetrical triangle support in just the span of three days.
Gold Technical Forecast: Daily Price Chart (April 2018 to April 2019) (Chart 1)
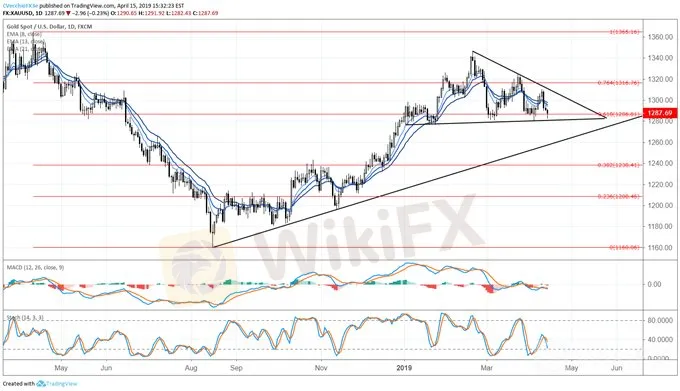
The move back towards symmetrical triangle support and the April low mean little right now as Gold prices remain within their consolidation. To this end, traders shouldnt be surprised that technical indicators are still relatively neutral.
However, there is evidence that momentum has begun to shift to the downside: price is below the daily 8-, 13-, and 21-EMA envelope; and both daily MACD and Slow Stochastics have started to turn lower below their respective median/neutral lines.
A move below the April low of 1280.80 would be a significant development in the days ahead and suggest that Gold prices may see a deeper setback towards the rising trendline from the August, September, and November 2018 lows near 1260 by the end of the month.
IG Client Sentiment Index: Spot Gold Price Forecast (April 15, 2019) (Chart 2)
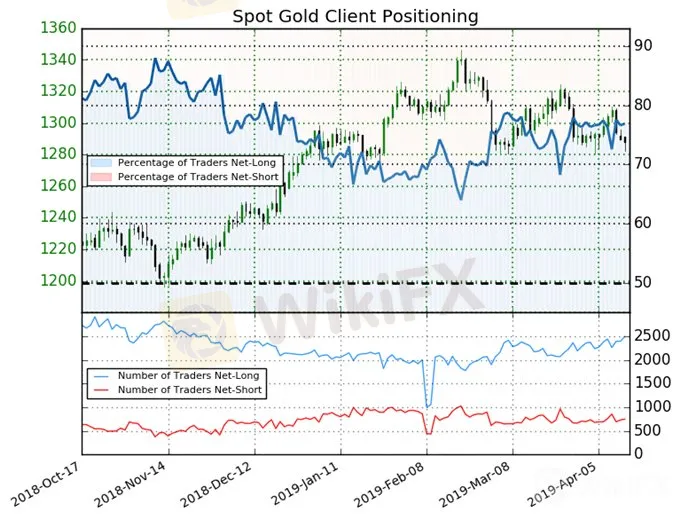
Spot Gold: Retail trader data shows 76.9% of traders are net-long with the ratio of traders long to short at 3.33 to 1. The number of traders net-long is 4.3% higher than yesterday and 9.0% higher from last week, while the number of traders net-short is 0.4% higher than yesterday and 4.5% higher from last week.
We typically take a contrarian view to crowd sentiment, and the fact traders are net-long suggests Spot Gold prices may continue to fall. Traders are further net-long than yesterday and last week, and the combination of current sentiment and recent changes gives us a stronger Spot Gold-bearish contrarian trading bias.
免責聲明:
本文觀點僅代表作者個人觀點,不構成本平台的投資建議,本平台不對文章信息準確性、完整性和及時性作出任何保證,亦不對因使用或信賴文章信息引發的任何損失承擔責任
天眼交易商
熱點資訊
平台展業全球卻無監管?Binomo邦耀被爆出金困難,潛藏投資危機
 WikiFX
美國FED到底是什麼?該機構具體有什麼作用?
WikiFX交易環境獲AAA評級的澳洲券商Neex好用嗎?點擊查看平台監管情形、用戶評價、運作狀況
WikiFX外匯天眼警報:3/24-3/30最新外匯詐騙券商黑名單
WikiFX受塞浦路斯、塞席爾監管的WisunoFX斯瑞好用嗎?監管情況、用戶評價、網站概況一次看
WikiFX外匯交易涵蓋哪些關鍵要素?
WikiFX匯率計算

