Sterling (GBP) Week Ahead: Risk, Brexit, NFPs and Flashing Signals
摘要:A busy week of global data, events and central bank speak will end with the monthly US non-farm payroll releases. And some UK asset charts are nearing important technical levels.
Sterling Price, Chart and Analysis
Busy week for data and events.
Technical indicators coming to the fore.
Q2 2019 GBP and USD Forecasts andTop Trading Opportunities
A very busy calendar this week with rate decisions from the RBA and ECB, ongoing Brexit and UK leadership news, US Fed speakers and the latest look at US non-farm payrolls. All this against a backdrop of deteriorating trade talks, heightened risk aversion and US President Donald Trumps visit to the UK.
DailyFX Calendar
The technical set-up on a variety of UK asset charts also show important indicators in-play, adding to already volatile markets.
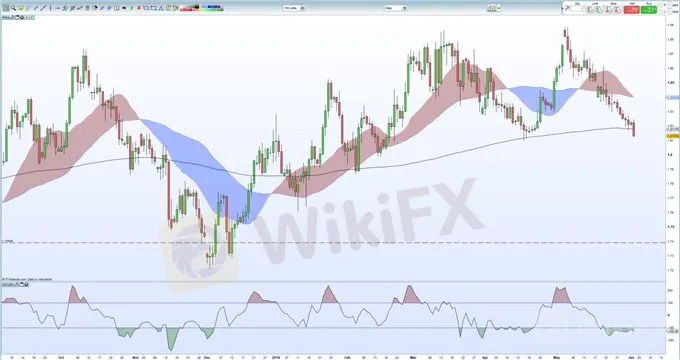
GBPAUD – 200-Day Moving Average Breaking Down.

FTSE 100 – 200-Day Moving Average and 38.2% Fibonacci Retracement

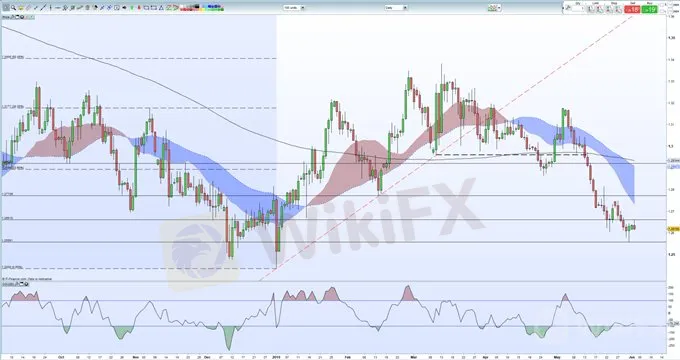
GBPUSD continues to drift lower despite a marginally weaker US dollar. A trading range may be setting up between last weeks low at 1.2560 and high around 1.2750, but the downtrend from the beginning of May still holds for now.
IG Client Sentiment data paints a negative picture for the pair with 81.1% of traders long GBPUSD, a bearish contrarian bias signal. However, recent daily and weekly positional changes give us a mixed trading bias for GBPUSD.
GBPUSD Daily Price Chart (September 2018 – June 3, 2019)

Traders may be interested in two of our trading guides – Traits of Successful Traders and Top Trading Lessons – while technical analysts are likely to be interested in our latest Elliott Wave Guide.
What is your view on GBPUSD – bullish or bearish? You can let us know via the form at the end of this piece or you can contact the author at nicholas.cawley@ig.comor via Twitter @nickcawley1.
免責聲明:
本文觀點僅代表作者個人觀點,不構成本平台的投資建議,本平台不對文章信息準確性、完整性和及時性作出任何保證,亦不對因使用或信賴文章信息引發的任何損失承擔責任
天眼交易商
熱點資訊
平台展業全球卻無監管?Binomo邦耀被爆出金困難,潛藏投資危機
外匯交易涵蓋哪些關鍵要素?
Virtus Capital驚爆高風險:網站消失、網域待售,疑似割完韭菜就跑路!
讓時間成為自己投資最強大的盟友
又見高風險平台?Nova Finance監管疑似套牌,先後遭法國AMF、加拿大CSA示警
一位交易者的心靈修行
匯率計算


