


Bitcoin Price Chart is Coiled like a Spring, will it Bounce or Break?
摘要:Bitcoin has seen its trading range narrow as bulls and bears hash out price action on the ledge of nearby support which, if broken, could see BTCUSD price slump another 20%.
Bitcoin Price Forecast:
Bitcoin is up 153% in the year-to-date, but recent price action suggests the cryptos bullish trend is threatened
To that end, an ascending trendline from mid-May could mark the line in the sand for medium-term BTCUSD price
Interested in cryptocurrency? Check out our Bitcoin Predictions & Facebook Libra Podcast with Tone Vays
Bitcoin Price Chart is Coiled like a Spring, will it Bounce or Break?
After surging 260% in 2019 to nearly $14,000 last month, Bitcoin is taking a breather and threatening a critical tailwind to its continuation higher. The ascending trendline from mid-May provided support in June and has done so again in late July. A series of recent tests have probed the line, but bulls appear unwilling to surrender at this time. That said, hourly stochastic RSI is tiptoeing into overbought territory and could see bears pressure price back down to the level – which now enjoys confluence with a Fibonacci level at $9,545. If confluent support is unable to rebuke bears at this level, it is a worrisome sign for Bitcoin in the coming days.
Interested in longer-term trades? Check out our Third Quarter Forecasts for Gold, EURUSD and more.
Bitcoin Price Chart: 1 – Hour Time Frame (June – July) (Chart 1)
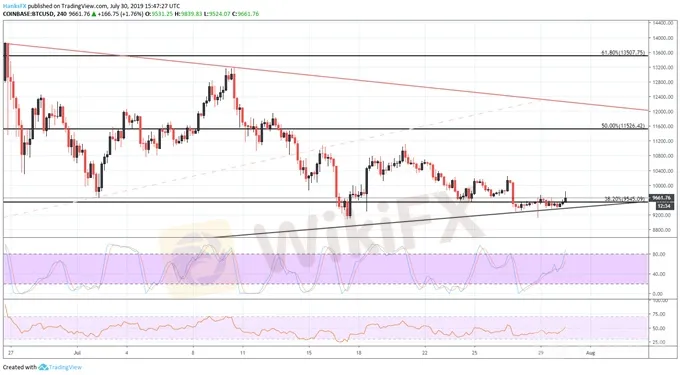
Chart created in TradingView
Over the longer-term however, stochastic RSI is wading in oversold territory as RSI continues to trend lower alongside price. Should the confluence of support keep Bitcoin afloat and allow bulls to retake control, resistance may reside at the 50% retracement level around $11,525 and around $12,000 marked by the descending trendline from Junes high. If price holds above support, BTC may work itself into somewhat of a wedge marked by the converging trendlines.
Bitcoin Price Chart: Daily Time Frame (May – July) (Chart 2)

Chart created in TradingView
If, on the other hand, Bitcoin bulls are unable to hold above $9,545, a break beneath could quickly accelerate into a larger move as bullish bets unfold and the overarching trend higher is called into question. In this circumstance, initial support would look to reside around $7,093 – marked by the 23.6% Fib level. Further, Bitcoin volatility has been relatively muted as the cryptocurrency slowly bleeds to support but a failure at this level would likely spark volatility as traders look to reposition amid the new technical landscape.
免責聲明:
本文觀點僅代表作者個人觀點,不構成本平台的投資建議,本平台不對文章信息準確性、完整性和及時性作出任何保證,亦不對因使用或信賴文章信息引發的任何損失承擔責任
天眼交易商
熱點資訊
3/10-3/16最新外匯詐騙風險平台曝光
 WikiFX
Mitrade EU 推出無紙化 KYC 及勞合社超額損失保險,提升 CFD 交易體驗
WikiFX外匯天眼測評AIMS:監管情形、使用軟體、交易體驗、網站運作全面解析!
WikiFX人工欺詐時代來臨:CFTC警告AI詐騙正欺騙投資人
WikiFXtegasFX天眼評測報告:監管疑慮&客訴過多,請投資人務必警惕!
WikiFX詐騙風險警告:TKEX投資人無法出金,客服失聯、官網關閉,恐已爆雷跑路
WikiFXVT Markets 推出自營交易品牌
WikiFX用Dbinvesting做交易請當心!山寨網站吸金跑路,正版平台獲利難出金!
WikiFX匯率計算

