


Silver Price Outlook: XAG/USD Breakout Testing Uptrend Resistance
摘要:Silver prices surged nearly 30% off the May lows with the rally now probing critical resistance. Here are the levels that matter on the XAG/USD weekly chart.
Silver price breakout testing confluence up-trend resistance- longs vulnerable sub-18.65
Join Michael for Live Weekly Strategy Webinars on Mondays at 12:30GMT
Silver prices have surged nearly 30% of the May lows with the breakout now probing a critical resistance confluence at fresh two-year highs. These are the updated targets and invalidation levels that matter on the XAG/USD weekly price chart heading into the close of August trade. Review my latest Weekly Strategy Webinar for an in-depth breakdown of this Silver price setup and more.
Silver Price Chart - XAG/USD Weekly
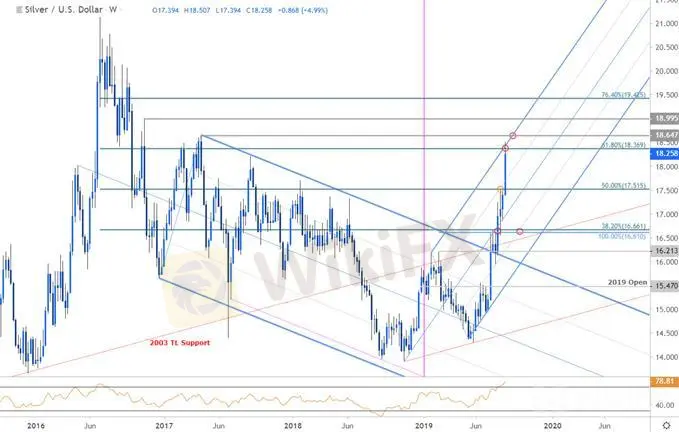
Chart Prepared by Michael Boutros, Technical Strategist; Silver on Tradingview
Notes: In my previous Silver Price Weekly Outlook we noted that XAG/USD was “approaching the first major resistance hurdle at 16.61/66 – a breach / weekly close above is needed to keep the long-bias viable targeting 17 and beyond.” A topside breach two weeks later fueled the next leg higher in price with silver now probing a more significant resistance confluence at 18.37 (high registered at 18.50 before pulling back). This region is defined by the 61.8% retracement of the 2016 decline with the upper parallel of the ascending pitchfork formation weve been tracking off the 2018 low - just higher.
A topside breach / weekly close above the 2017 swing high at 18.65 is needed to validate a breakout with such a scenario keeping the focus on subsequent topside resistance objectives at the 19-handle and the 76.4% retracement at 19.42. Initial weekly support now back at the 75% parallel (currently ~17.70s) backed b 17.52. Broader bullish invalidation now raised to 16.61/66.
For a complete breakdown of Michaels trading strategy, review his Foundations of Technical Analysis series on Building a Trading Strategy
Bottom line: Silver prices are testing uptrend resistance around 18.37/65 - a breach / close above this region is needed to keep the broader long-bias viable. From a trading standpoint, a good zone to reduce long-exposure / raise protective stops – look for evidence of price exhaustion up here. Ultimately, a larger decline may offer more favorable long-entries closer to trend support. Ill publish an updated Silver Price Outlook once we get further clarity on the near-term technical levels in XAG/USD.
Even the most seasoned traders need a reminder every now and then- Avoid these Mistakes in your trading
Silver Trader Sentiment - XAG/USD

A summary of IG Client Sentiment shows traders are net-long Silver (XAG/USD) - the ratio stands at +4.39 (81.4% of traders are long) – bearish reading
Long positions are 2.2% lower than yesterday and 3.1% lower from last week
Short positions are 18.6% higher than yesterday and 63.9% higher from last week
We typically take a contrarian view to crowd sentiment, and the fact traders are net-long suggests Spot Silver prices may continue to fall. Yet traders are less net-long than yesterday & compared with last week. Recent changes in sentiment warn that the current Spot Silver price trend may soon reverse higher despite the fact traders remain net-long.
See how shifts in Silver retail positioning are impacting trend- Learn more about sentiment!
---
Previous Weekly Technical Charts
Crude Oil (WTI)
Sterling (GBP/USD)
Gold (XAU/USD)
Canadian Dollar (USD/CAD)
US Dollar (DXY)
免責聲明:
本文觀點僅代表作者個人觀點,不構成本平台的投資建議,本平台不對文章信息準確性、完整性和及時性作出任何保證,亦不對因使用或信賴文章信息引發的任何損失承擔責任
天眼交易商
熱點資訊
什麼是美元指數,哪些因素影響美元指數走勢?
 WikiFX
外匯投資中如何規避黑平台風險 | 外匯天眼帶你從牌照監管識破黑平台風險
WikiFXBIW Management遭英國FCA示警、平台資訊疑造假,恐為外匯詐騙券商
WikiFX交易認知變成實踐,必須要有「悟」的過程!
WikiFX速報:知名外匯券商FXCM福匯出現仿冒詐騙平台,註冊、入金前請務必比對網址
WikiFXEAST投資詐騙手法全揭露!誆稱投資3萬獲利4100%,藉口資金卡住騙繳費
WikiFXXS平台驚爆詐欺客戶?無預警撤銷獲利、凍結帳戶,違規操作頻傳問題多
WikiFXDoo Prime 2月份交易量超過1340億美元
WikiFX匯率計算

