简体中文
繁體中文
English
Pусский
日本語
ภาษาไทย
Tiếng Việt
Bahasa Indonesia
Español
हिन्दी
Filippiiniläinen
Français
Deutsch
Português
Türkçe
한국어
العربية


Bitcoin (BTC) Price Outlook: A New Rally Simmering or a Bull Trap?
Abstract:Bitcoin is back in the headlines with sharp gains over the last two days, sparking rallies across the board in the cryptocurrency market. The million-dollar question – is the rally sustainable?
Bitcoin (BTC) Price Analysis, News and Chart:
Bitcoin (BTC) breakout spurs larger market advance.
Bitcoin Cash (BCH) ripping higher
DailyFX Bitcoin Landing Page – Prices, Charts, Analysis and Real-Time News
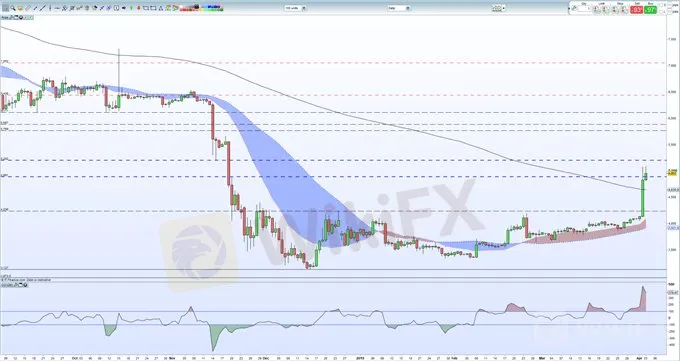
The cryptocurrency market dominated headlines Tuesday after sharp gains across the board with market heavyweight Bitcoin spiking nearly $1,000 higher in a few hours, before edging off its high. The rally took Bitcoin back to highs last seen in November and into a gap on the November 19 bear candle between $4,891 and $5,202. Today‘s price action has seen yesterday’s high hold for now and just below the $5,000 level. The chart below highlights two important technical indicators with BTC currently above the important 200-day moving average at $4,645 while the CCI indicator shows Bitcoin in extreme overbought territory. If bitcoin moves and closes below the long-term moving average, a potential pull-back to $4,236, the breakout level, is likely on the cards. A clean break and close above $5,202 could bring old horizontal resistance levels all the way back to $6,000+ back into play.
A Guide to Day Trading Bitcoin & Other Cryptocurrencies.
Bitcoin (BTC) Daily Price Chart (September 2018 – April 3, 2019)
Bitcoin Cash (BCH) Surges to a Fresh Multi-Month High.
Not to be outdone, Bitcoin Cash has surged by 40% in the last 24-hours according to data from Coinmarketcap and is back to levels last seen in mid-November 2018 when the coin forked.

It should also be noted that stable coin Tether (USDT) has traded nearly eleven times its circulating supply/market cap in the last 24-hours. The last time Tether volume surged was in mid-December 2018 when markets traded at or near their recent lows.
The last few weeks has seen low volume and volatility in Bitcoin Cash (BCH) and as such any above normal buying interest, either outright or short-closing, will, and has, produced a sharp market reaction. The 200-day moving average has been breached today and further confirmation of a change in market sentiment will need to be qualified by a close above this level ($255) before looking at further upside. The CCI indicator again shows the coin in extreme overbought territory.
Bitcoin Cash (BCH) Daily Price Chart (September 2018 – April 3, 2019)

IG Client Sentiment shows that retail traders are 78.4% net-long of Bitcoin, a bearish contrarian indicator. However, the recent daily and weekly positional changes give us a mixed trading bias.
Disclaimer:
The views in this article only represent the author's personal views, and do not constitute investment advice on this platform. This platform does not guarantee the accuracy, completeness and timeliness of the information in the article, and will not be liable for any loss caused by the use of or reliance on the information in the article.
Read more

OnEquity Empowers Traders with High Leverage Options Across Diverse Markets
OnEquity, a leading online trading platform, announces its extensive leverage options, offering traders greater control and flexibility across various markets including commodities, CFDs on stocks, indices, cryptocurrencies, oil, and precious metals.

Financial Markets Update: Stocks Soar Amidst Tech Surge and Dollar Decline
Volatility Persists as Cryptocurrencies React to Regulatory Developments

Bitcoin Hits Three-month Low
"We thought you as Jhon Snow But you become White Walker @elonmusk".

Bitcoin (BTC) Price Battles Recent Highs as Technical Indicators Clash
Bitcoins recent $1300 rebound has ground to a halt as buyers and sellers battle to gain the upper hand. The daily chart is not giving either a great deal of help.
WikiFX Broker
Latest News
Trade, Compete, Win: Enter the WikiFX World Elite Trading Championship
 WikiFX
Kraken Eyes $1.5B Acquisition of NinjaTrader for Futures Trading
WikiFXDark Side of Finfluencers: They Aren’t Your Financial Friends!!
WikiFXGCash Adds USDC to GCrypto for Secure Crypto Trading in Philippines
WikiFXKraken Acquires NinjaTrader for $1.5B to Lead US Futures Market
WikiFXDFA Rescues Over 100 Filipinos from Myanmar Scam Hubs
WikiFXVanishing Fortunes: RM1.9 Million Lost in a Crypto Scam
WikiFXWhat Project 2025 Means for Tariffs and Trade on April 2
WikiFXFX vs Crypto Trading: Which Strategy is Best for You in 2025?
WikiFXSILEGX Scam Investigation Uncovers 46 Cases and RM41.5 Million Losses
WikiFXCurrency Calculator

