简体中文
繁體中文
English
Pусский
日本語
ภาษาไทย
Tiếng Việt
Bahasa Indonesia
Español
हिन्दी
Filippiiniläinen
Français
Deutsch
Português
Türkçe
한국어
العربية
Crude Oil Prices Pushing USD/NOK Down - USD/SEK Faces Resistance
Abstract:The recent surge in crude oil prices have pushed USDNOK again dangerously close to the lower bound of the rising support channel while USDSEK struggles to break above 9.3110.
NORDIC FX, NOK, SEK WEEKLY OUTLOOK
NORDIC FX,NOK,SEK每周展望
Are crude oil prices causing USDNOK to re-test support?
原油价格是否导致USDNOK重新上涨 - 测试支持?
USDSEK struggling to break through 9.3110 resistance
美元兑日元努力突破9.3110阻力
Riksbank to be key catalyst for breaking USDSEK range?
瑞典央行是打破美元兑日元区间的关键催化剂?
See our free guide to learn how to use economic news in your trading strategy!
请参阅我们的免费指南,了解如何使用经济新闻在您的交易策略中!
USD/SEK TECHNICAL ANALYSIS
美元/瑞典科技分析
As forecasted in last week‘s technical outlook, USD/SEK has traded in a new range between 9.2273-9.3110. Even after Sweden’s dismal unemployment data was released, the pair spiked but closed just below the upper bound. The lack of follow-through signals a lack of confidence in the pairs ability to trade above 9.3110 consistently and to use it as a new floor should it give way.
正如上周的技术展望预测,美元/瑞典克朗在9.2273-9.3110之间的新范围内交易。即使在瑞典失业数据公布后,该货币对仍然飙升,但收盘时略低于上限。缺乏后续信号表明对货币对在9.3110之间持续交易的能力缺乏信心,并且如果它让位,则将其用作新的底线。
USDSEK – Daily Chart
USDSEK - Daily Chart

However, despite the lack of follow-through, for the past few days the pair has been trading on the cusp of the upper lip, signaling that perhaps traders are eager to try again to breaking above it again It is worth noting that the pair has repeatedly tested and broken through the upper bound, though it ultimately always retreated.
然而,尽管缺乏跟进,过去几天该货币对一直处于上唇的尖端,表明交易者可能是渴望再次尝试再次超越它值得注意的是,该对已经反复测试并突破了上限,尽管它最终总是退缩。
The biggest jump was on March 7 when the ECB announced its rate decision and was followed by a dismal outlook that sent Nordic currencies down and pushed USDSEK to a 17-year high. The next potential event risk that could trigger such a jump is the upcoming Riksbank rate decision and commentary on April 25. Depending on the outcome, it could send the pair beyond 9.3110 and provide enough of a boost that the pair uses it as new support.
最大的跳跃是3月7日欧洲央行宣布其利率决定,随后出现令人沮丧的前景,导致北欧货币下跌并推动美元兑瑞郎升至17年高位。可能引发此类跳跃的下一个潜在事件风险是即将到来的瑞典央行利率决定和4月25日的评论。根据结果,它可能会使该货币对超过9.3110并提供足够的提升,该货币对将其用作新支撑。
Zooming out, the pair has been trading around a three-year high since February and is still traveling along the 2018 rising support channel. The continuous climb on the steep incline suggests a bullish bias for the pair with the fundamental outlook suggesting a continuation for the current trend for the next few months and possibly till year-end.
此外,该货币对一直处于三年来的高位。二月,仍然沿着2018年上升的支持渠道旅行。在陡峭的斜坡上持续攀升表明该货币对的看涨偏见与基本面前景暗示未来几个月的当前趋势将延续,并可能持续到年底。
USDSEK – Weekly Chart
USDSEK - 每周图表

USD/NOK TECHNICAL ANALYSIS
美元/挪威克朗技术分析
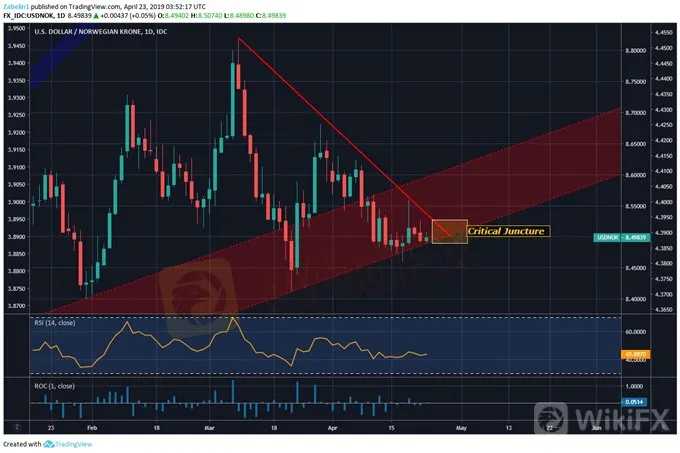
USD/NOK is once again trading around the lower bound of the upward-sloping March 2018 support (red parallel lines). The flirtation is being prompted by rising crude oil prices, particularly following yesterdays decision by the US to discontinue Iranian oil importing waivers. The oil-linked Norwegian Krone rose on the news, promptly pushing USD/NOK lower.
美元/挪威克朗再次交易于下跌区域附近向上倾斜2018年3月支撑(红色平行线)。原油价格上涨引发了调情,特别是在昨天美国决定停止伊朗石油进口放弃之后。与石油挂钩的挪威克朗在新闻中上涨,迅速推动美元/挪威克朗走低。
USD/NOK – Daily Chart
USD / NOK - 每日图表

Whats telling is despite the rise in crude oil prices to their highest point since November 2019 – giving further impetus for the Norges Bank to raise rates again in June – USD/NOK continues to trade higher. The upward climb suggests an underlying bullish outlook for the pair despite the gains made in oil. A break below the 1-year support with follow would signal a critical reversal for the pair.
尽管原油价格上涨至2019年11月以来的最高点,但仍有进一步的推动 - 进一步推动挪威银行在6月再次加息 - 美元/挪威克朗继续走高。尽管石油价格上涨,但该货币对上涨表明该货币对的潜在看涨前景。如果跌破1年支撑位,则表明该货币对将发生严重逆转。
Coming up next is the descending resistance (red line). Since March 8, the pair has traded below it, though given the choice between breaking below support or breaking through resistance, the overall trajectory suggests a higher probability of the latter. Were the pair to break below support with confirmation, traders with long positions might find themselves covering their positions amid the reversal.
接下来是下行阻力位(红线)。自3月8日以来,该货币对一直在低于它的交易,尽管在突破支撑位或突破阻力位之间做出选择,整体轨迹表明后者的概率较高。 WER在确认下,支撑位突破支撑位,多头交易者可能会发现自己在逆转期间覆盖其头寸。
USD/NOK – Daily Chart
KRONA, NORWEGIAN KRONE TRADING RESOURCES
KRONA,NORWEGIAN KRONE TRADING RESOURCES
--- Written by Dimitri Zabelin, Jr Currency Analyst for DailyFX.com
---由DailyFX.com的Jr货币分析师Dimitri Zabelin撰写
Disclaimer:
The views in this article only represent the author's personal views, and do not constitute investment advice on this platform. This platform does not guarantee the accuracy, completeness and timeliness of the information in the article, and will not be liable for any loss caused by the use of or reliance on the information in the article.
WikiFX Broker
Latest News
SEC charges UK citizen for hacking
 WikiFX
Is Forex trading legal in the Middle East?
WikiFXAIFactor Faces Allegations of Fraud and Investor Exploitation
WikiFXTD Bank Nears Guilty Plea in Money Laundering Case
WikiFXChinese Stocks Soar Most Since 2015
WikiFXSaxo Bank Closes Hong Kong and Shanghai, Focuses on Singapore Growth
WikiFXHow Has Changpeng Zhao's Prison Release Shaped His Future?
WikiFXNORDFX Mega Super Lottery 2024
WikiFXXM "Black-Tie Gala" 2024
WikiFXFCA Issues Latest Warning Against Unlicensed 13 Forex Brokers
WikiFXCurrency Calculator

