简体中文
繁體中文
English
Pусский
日本語
ภาษาไทย
Tiếng Việt
Bahasa Indonesia
Español
हिन्दी
Filippiiniläinen
Français
Deutsch
Português
Türkçe
한국어
العربية
Euro May Remain at Risk, But What are EUR/USD Levels to Watch for Reversal Hints?
Abstract:Euro likely remains pressured against the US Dollar before the ECB this week. The hourly setting appears to be showing preliminary signs of trend exhaustion. What are key EUR/USD levels to watch to help confirm reversal potential?
EURO TECHNICAL ANALYSIS
The Euro is coming off the worst week against the US Dollar in almost 2 years. On the daily setting, EUR/USD continues to be in a precarious state. Markets do not move in a straight line however. Zooming in on shorter timeframes, such as the 1-hour setting, could offer preliminary warnings of exhaustion. Is this the case for the Euro?
It should be noted that the swings of Russias attack on Ukraine remain a source of fundamental volatility due to proximity risk for the Euro. The European Central Bank will also be meeting on March 10th to set monetary policy. Expectations for a hawkish approach later this year have been notably cut back. Still, proximity risk to the ECB rate decision may offer the Euro some breathing space in the interim.
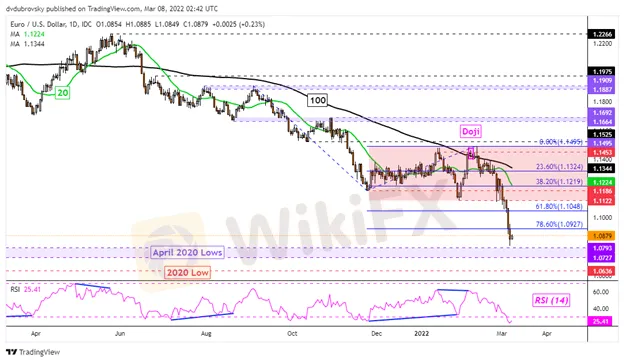
On the daily chart below, EUR/USDs slide has brought it closer and closer to lows from April 2020. These make for a range of support between 1.0727 and 1.0793, before the 2020 kicks in at 1.0636. In the near-term, keep a close eye on the 20-day Simple Moving Average (SMA). This could hold as resistance in the event prices pivot higher, reinstating the dominant downside focus.
Immediate resistance does seem to be the 78.6% Fibonacci extension at 1.0927, followed by the 61.8% level at 1.1048. Let us look at the hourly timeframe to see if there are preliminary signs of exhaustion building up.

EUR/USD 1-HOUR CHART
On the next chart below, EUR/USD can be seen establishing a potential range of support between 1.0804 – 1.0842. This is an hourly setting, so price action here can unfold rather quickly. It should be noted that as this zone formed, positive RSI divergence emerged, signaling fading downside momentum. This can at times precede bullish reversals.
In the event prices do turn higher, traders can keep a close eye on the 50- and 100-period SMAs. The former is sitting under potential resistance at 1.094. Breaking above the latter would expose the 100-period SMA. This can reinstate a downside focus, sending the Euro back to pressure the 1.0842 – 1.0804 support zone. Otherwise, confirming a breakout above the 100-period SMA could spell further gains in the near-term.

Disclaimer:
The views in this article only represent the author's personal views, and do not constitute investment advice on this platform. This platform does not guarantee the accuracy, completeness and timeliness of the information in the article, and will not be liable for any loss caused by the use of or reliance on the information in the article.
Read more

The Daily Habits of a Profitable Trader
Every professional trader follows a structured approach to ensure they are well-prepared, disciplined, and able to seize opportunities with confidence. Whether you are a seasoned investor or an aspiring trader, adhering to a robust daily checklist can significantly enhance your performance. Use this checklist to check if you are a qualified trader

How a Housewife Lost RM288,235 in a Facebook Investment Scam
A 47-year-old housewife in Malaysia recently fell victim to an online investment scam, losing a substantial sum of RM288,235 after engaging with a fraudulent scheme advertised on Facebook.

A Trader’s Worst Mistake: Overlooking Broker Reviews Could Cost You Everything
In today’s digital age, reviews influence nearly every decision we make. When purchasing a smartphone, television, or home appliance, we pore over customer feedback and expert opinions to ensure we’re making the right choice. So why is it that, when it comes to choosing an online broker where real money and financial security are at stake many traders neglect the crucial step of reading reviews?

Interactive Brokers Launches Forecast Contracts in Canada for Market Predictions
Interactive Brokers introduces Forecast Contracts in Canada, enabling investors to trade on economic, political, and climate outcomes. Manage risk with ease.
WikiFX Broker
Latest News
Interactive Brokers Launches Forecast Contracts in Canada for Market Predictions
Authorities Alert: MAS Impersonation Scam Hits Singapore
INFINOX Partners with Acelerador Racing for Porsche Cup Brazil 2025
Billboard Warns of Crypto Scams Using Its Name – Stay Alert!
The Impact of Interest Rate Decisions on the Forex Market
STARTRADER Spreads Kindness Through Ramadan Campaign
Rising WhatsApp Scams Highlight Need for Stronger User Protections
A Trader’s Worst Mistake: Overlooking Broker Reviews Could Cost You Everything
How a Housewife Lost RM288,235 in a Facebook Investment Scam
The Daily Habits of a Profitable Trader
Currency Calculator


